


| | | | |||
| orchidas : dev / LCCCI / Tools | Site Map |
Tools : cross-walking tables and mapping algorithms
1. ESA CCI classes → Generic PFTs
The following cross-walking table (CWT) is used to distribute ESA CCI classes into generic plant-functional types (PFTs). Additionally, the external Köppen—Geiger (KG) climate map is used. Several values are shown:
| CCI CLASS | KG CLASS | TREES | SHRUBS | GRASSES | Bare Soil | Water | Snow and Ice | Urban | No Data | |||||||
| TrBrEv | TrBrDe | TrNeEv | TrNeDe | ShBrEv | ShBrDe | ShNeEv | ShNeDe | NatGr | Crops | |||||||
| 0 no data |
100 | |||||||||||||||
| 10 cropland, rainfed |
10 0 |
90 100 |
||||||||||||||
| 11 cropland, rainfed, herbaceous cover |
10 0 |
90 100 |
||||||||||||||
| 12 cropland, rainfed, tree or shrub cover |
70 50 |
30 50 |
||||||||||||||
| 20 cropland, irrigated or post-flooding |
10 0 |
90 100 |
||||||||||||||
| 30 mosaic cropland (>50%) / natural vegetation (tree, shrub, herbaceous cover) (<50%) |
5 | 5 | 5 | 5 | 5 | 15 | 60 | |||||||||
| 40 mosaic natural vegetation (tree, shrub, herbaceous cover) (>50%) / cropland (<50%) |
7.5 5 |
7.5 5 |
10 7.5 |
15 10 |
10 7.5 |
30 25 |
20 40 |
|||||||||
| 50 tree cover, broadleaved, evergreen, closed to open (>15%) |
90 | 5 | 5 | |||||||||||||
| 60 tree cover, broadleaved, deciduous, closed to open (>15%) |
50 70 |
20 15 |
30 15 |
|||||||||||||
| 61 tree cover, broadleaved, deciduous, closed (>40%) |
70 | 15 | 15 | |||||||||||||
| 62 tree cover, broadleaved, deciduous, open (15-40%) |
30 | 25 | 45 35 |
0 10 |
||||||||||||
| 70 tree cover, needleleaved, evergreen, closed to open (>15%) |
70 | 5 | 5 | 5 | 15 | |||||||||||
| 71 tree cover, needleleaved, evergreen, closed (>40%) |
70 | 5 | 5 | 5 | 15 | |||||||||||
| 72 tree cover, needleleaved, evergreen, open (15-40%) |
30 | 0 5 |
25 5 |
45 30 |
0 30 |
|||||||||||
| 80 tree cover, needleleaved, deciduous, closed to open (>15%) |
50 70 |
2.5 5 |
2.5 5 |
2.5 5 |
12.5 0 |
30 15 |
||||||||||
| 81 tree cover, needleleaved, deciduous, closed (>40%) |
70 | 5 | 5 | 5 | 15 | |||||||||||
| 82 tree cover, needleleaved, deciduous, open (15-40%) |
30 | 0 5 |
0 5 |
25 0 |
45 30 |
0 30 |
||||||||||
| 90 tree cover, mixed leaf type (broadleaved and needleleaved) |
30 | 20 | 10 | 5 | 5 | 5 | 25 15 |
0 10 |
||||||||
| 100 mosaic tree and shrub (>50%) / herbaceous cover (<50%) |
10 | 20 | 5 | 5 | 5 | 10 | 5 | 40 | ||||||||
| 110 mosaic herbaceous cover (>50%) / tree and shrub (<50%) |
5 | 10 | 5 | 5 | 10 | 5 | 60 | |||||||||
| 120 shrubland |
def | 20 | 20 | 20 | 20 | 20 | ||||||||||
| 1 | 15 | 30 | 15 | 40 | ||||||||||||
| 21 | 15 | 30 | 15 | 40 | ||||||||||||
| 22 | 15 | 30 | 15 | 40 | ||||||||||||
| 31 | 20 | 40 | 20 | 20 | ||||||||||||
| 32 | 20 | 40 | 20 | 20 | ||||||||||||
| 121 shrubland, evergreen |
def | 30 | 30 | 20 | 20 | |||||||||||
| 1 | 30 | 30 | 40 | |||||||||||||
| 21 | 30 | 30 | 40 | |||||||||||||
| 22 | 30 | 30 | 40 | |||||||||||||
| 31 | 40 | 40 | 20 | |||||||||||||
| 32 | 40 | 40 | 20 | |||||||||||||
| 122 shrubland, deciduous |
def | 60 | 20 | 20 | ||||||||||||
| 1 | 60 | 40 | ||||||||||||||
| 21 | 60 | 40 | ||||||||||||||
| 22 | 60 | 40 | ||||||||||||||
| 31 | 80 | 20 | ||||||||||||||
| 32 | 80 | 20 | ||||||||||||||
| 130 grassland |
100 60 |
0 40 |
||||||||||||||
| 140 lichens and mosses |
100 60 |
0 40 |
||||||||||||||
| 150 sparse vegetation (tree, shrub, herbaceous cover) (<15%) |
def | 1 | 3 | 1 | 1 | 3 | 1 | 5 | 85 | |||||||
| 1 | 5 | 5 | 20 | 70 | ||||||||||||
| 21 | 5 | 5 | 5 | 5 | 30 | 50 | ||||||||||
| 22 | 5 | 5 | 5 | 5 | 30 | 50 | ||||||||||
| 31 | 3 | 3 | 3 | 4 | 4 | 3 | 65 | 15 | ||||||||
| 32 | 3 | 3 | 3 | 4 | 4 | 3 | 65 | 15 | ||||||||
| 151 sparse trees (<15%) |
def | 2 | 6 | 2 | 5 | 85 | ||||||||||
| 1 | 10 | 20 | 70 | |||||||||||||
| 21 | 10 | 10 | 30 | 50 | ||||||||||||
| 22 | 10 | 10 | 30 | 50 | ||||||||||||
| 31 | 7.5 | 7.5 | 5 | 65 | 15 | |||||||||||
| 32 | 7.5 | 7.5 | 5 | 65 | 15 | |||||||||||
| 152 sparse shrub (<15%) |
def | 2 | 6 | 2 | 5 | 85 | ||||||||||
| 1 | 10 | 20 | 70 | |||||||||||||
| 21 | 10 | 10 | 30 | 50 | ||||||||||||
| 22 | 10 | 10 | 30 | 50 | ||||||||||||
| 31 | 7.5 | 7.5 | 5 | 65 | 15 | |||||||||||
| 32 | 7.5 | 7.5 | 5 | 65 | 15 | |||||||||||
| 153 sparse herbaceous cover (<15%) |
def | 15 | 85 | |||||||||||||
| 1 | 30 | 70 | ||||||||||||||
| 21 | 50 | 50 | ||||||||||||||
| 22 | 50 | 50 | ||||||||||||||
| 31 | 85 | 15 | ||||||||||||||
| 32 | 85 | 15 | ||||||||||||||
| 160 tree cover, flooded, fresh or brakish water |
37.5 30 |
37.5 30 |
25 20 |
0 20 |
||||||||||||
| 170 tree cover, flooded, saline water |
75 60 |
25 20 |
0 20 |
|||||||||||||
| 180 shrub or herbaceous cover, flooded, fresh/saline/brakish water |
0 5 |
0 10 |
25 10 |
15 5 |
60 40 |
0 30 |
||||||||||
| 190 urban areas |
0 2.5 |
0 2.5 |
0 15 |
0 75 |
0 5 |
100 0 |
||||||||||
| 200 bare areas |
100 | |||||||||||||||
| 201 bare areas, consolidated |
100 | |||||||||||||||
| 202 bare areas, unconsolidated |
100 | |||||||||||||||
| 210 water bodies |
100 | |||||||||||||||
| 220 permanent snow and ice |
100 | |||||||||||||||
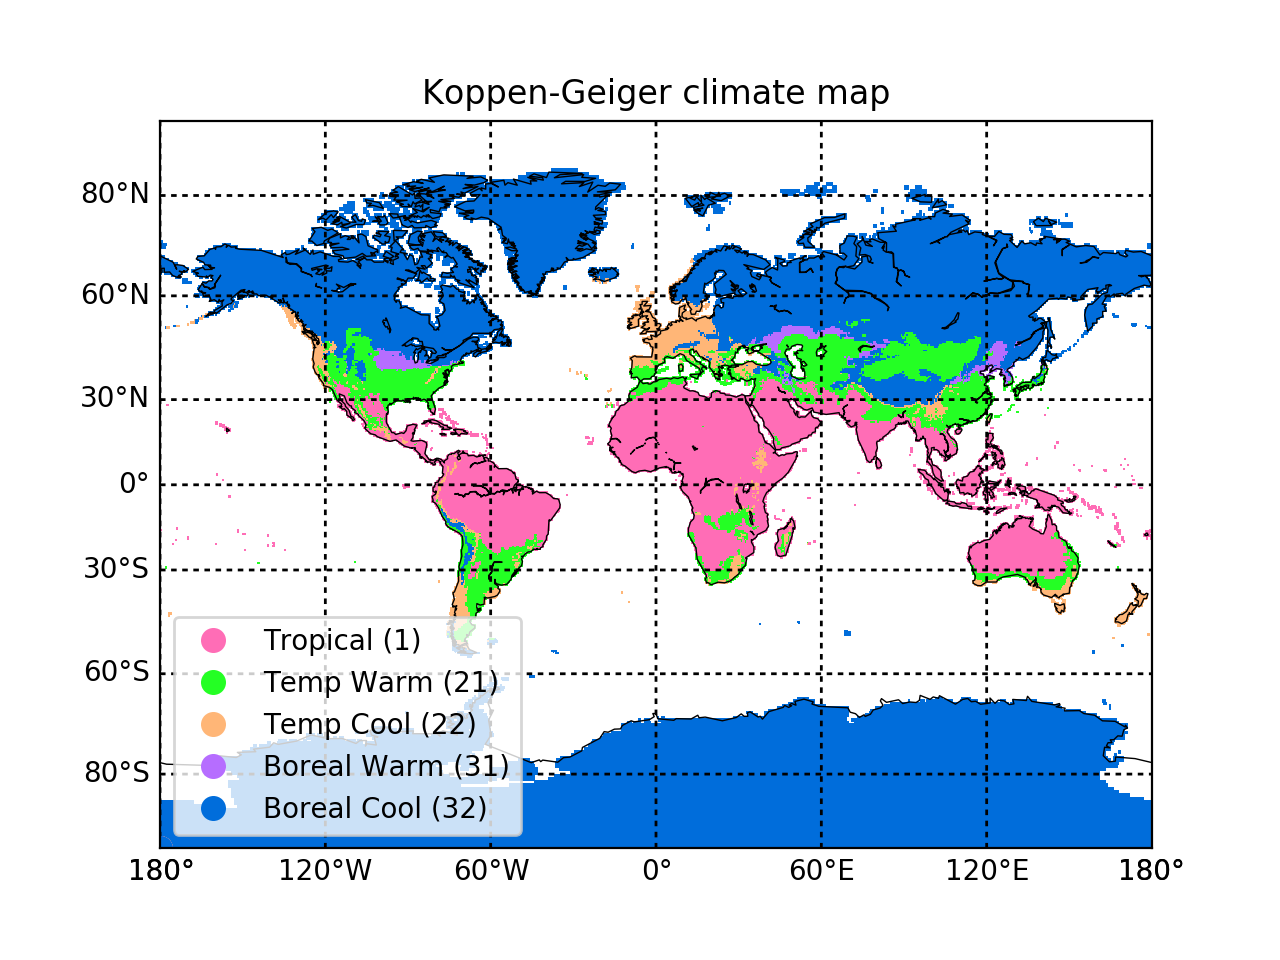
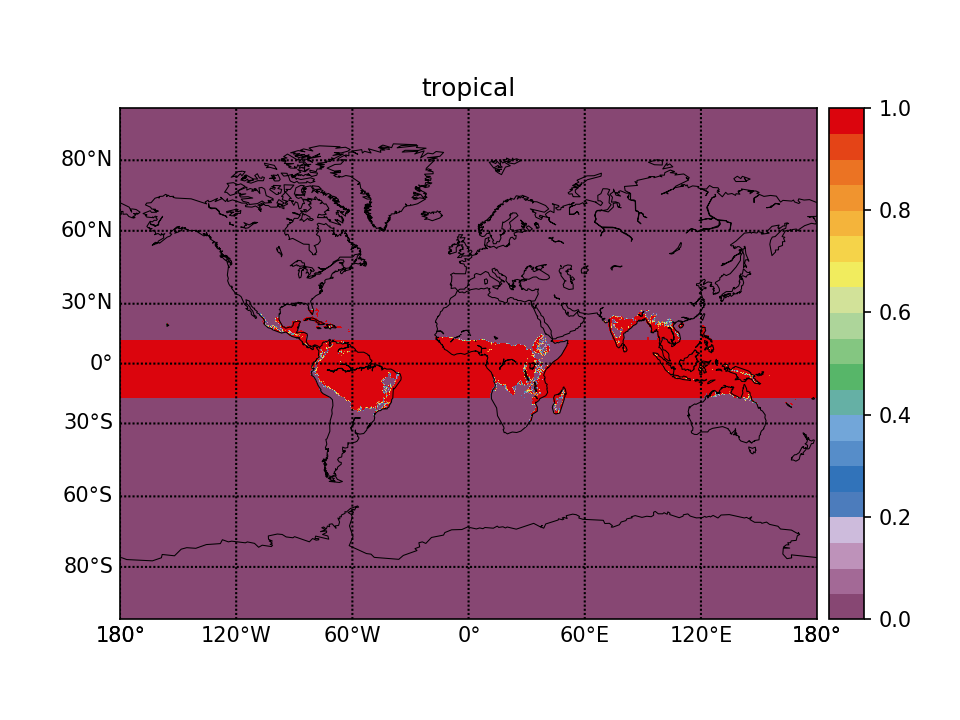
2. Köppen—Geiger climate map
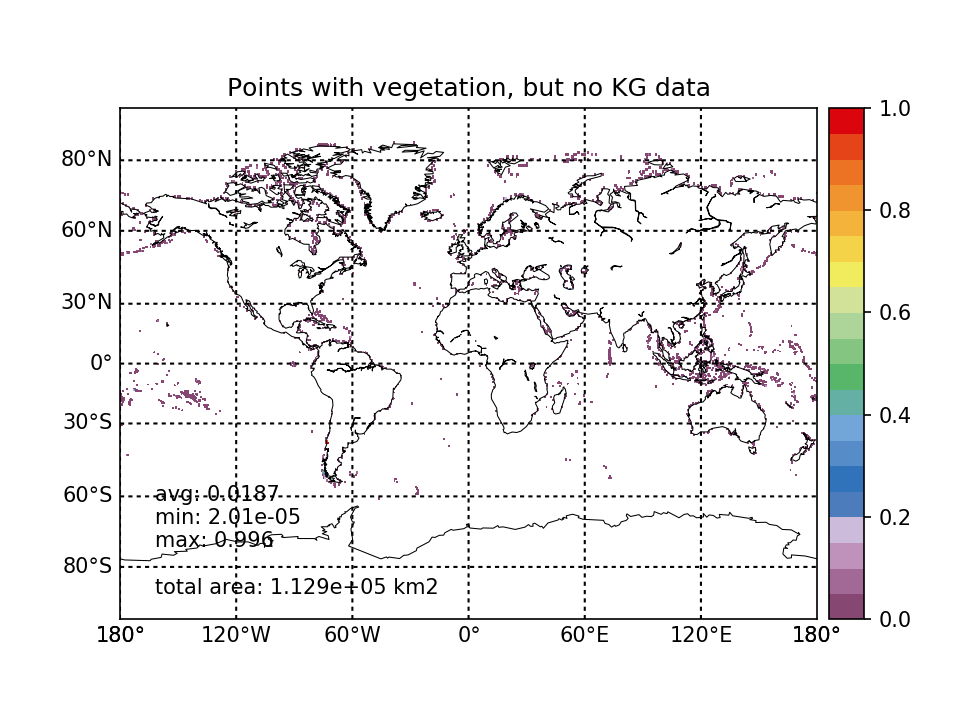
The Köppen—Geiger climate map is used to refine above CWT for different climate zones (see the second column). Since the Köppen—Geiger map does not cover all land points from ESA dataset, it has been additionally expanded over the ocean filling with the dominant value for each latitude.

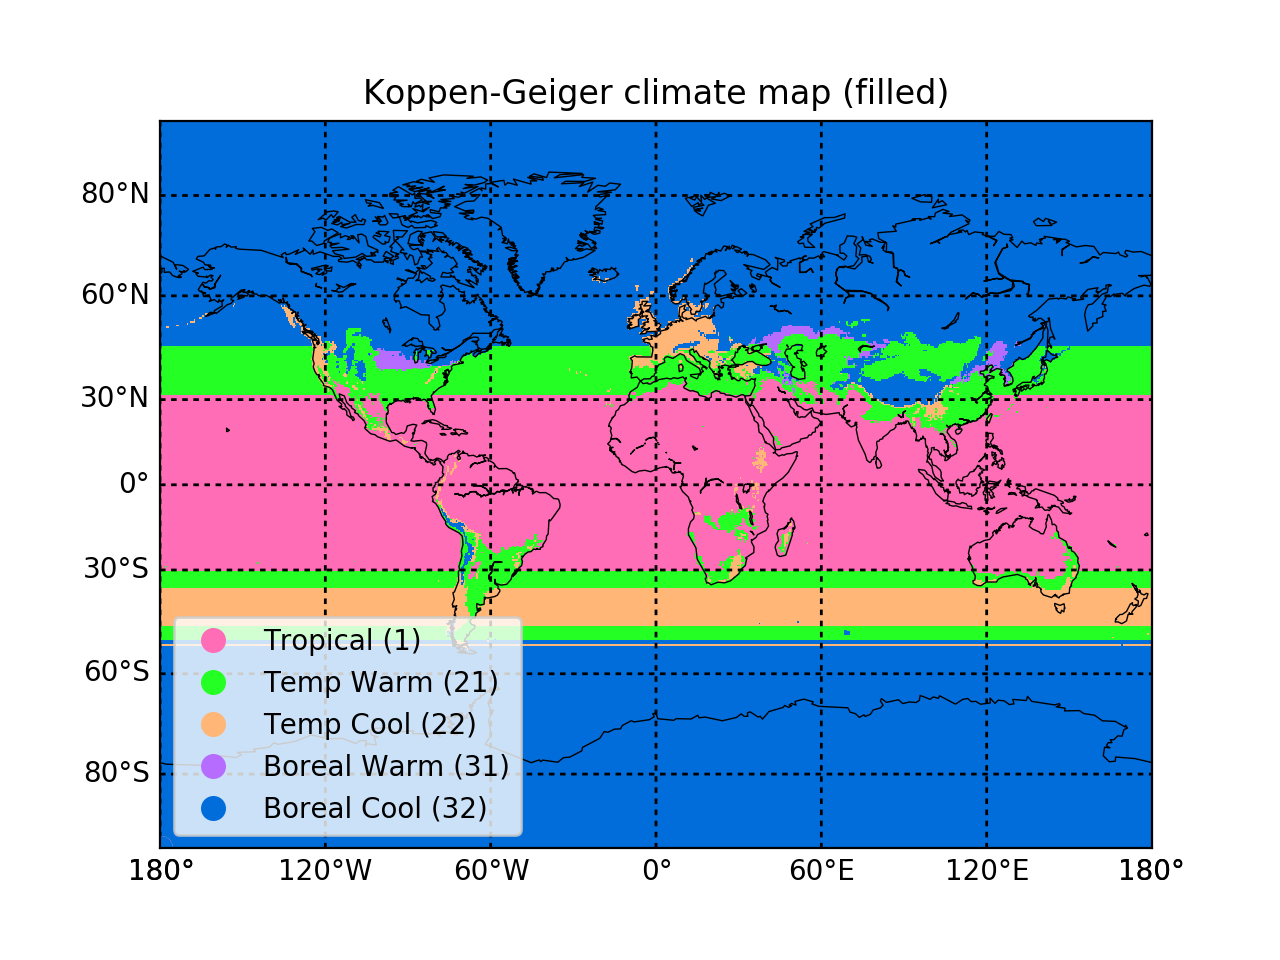
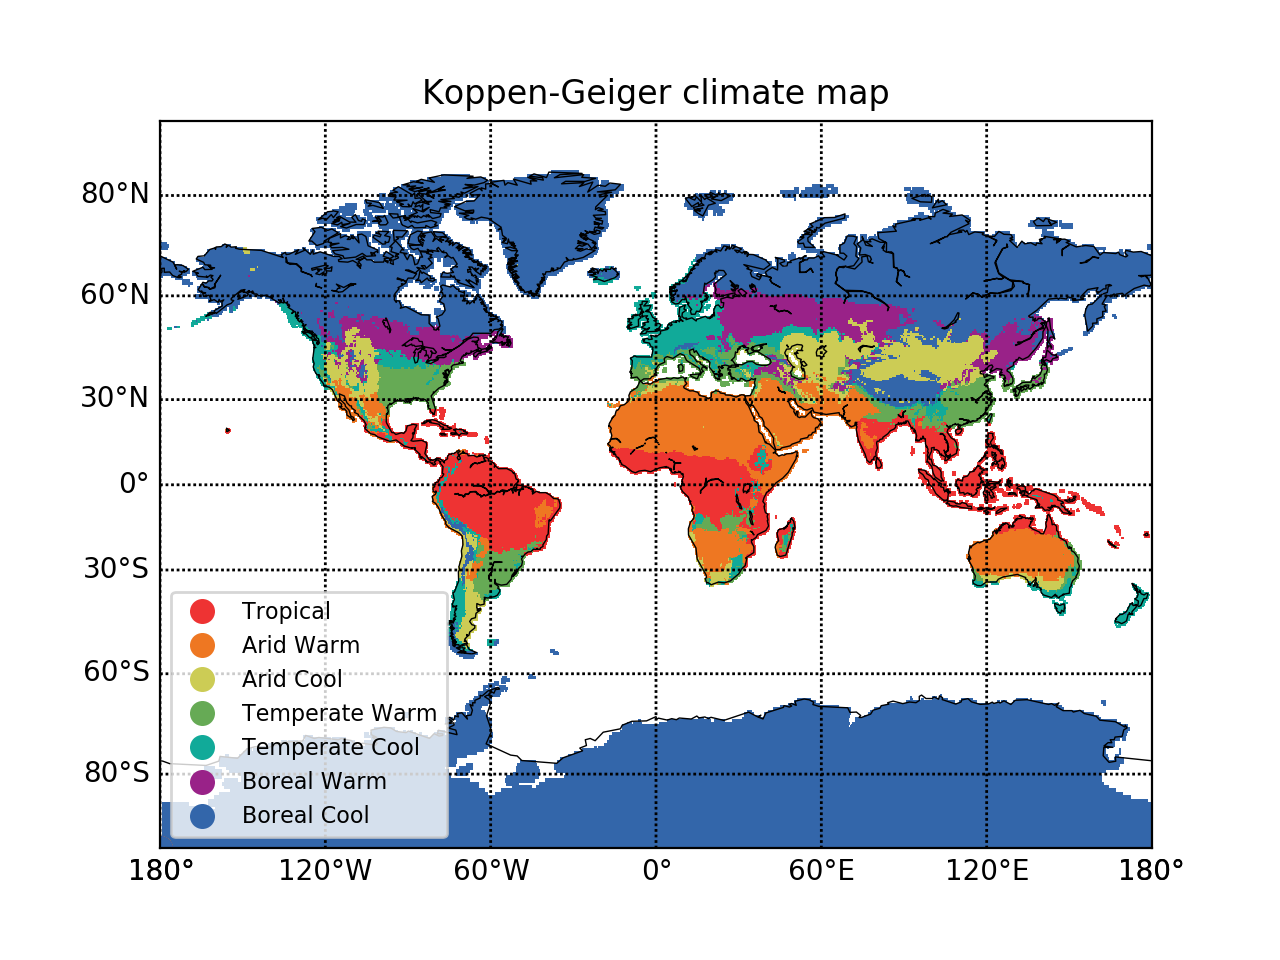
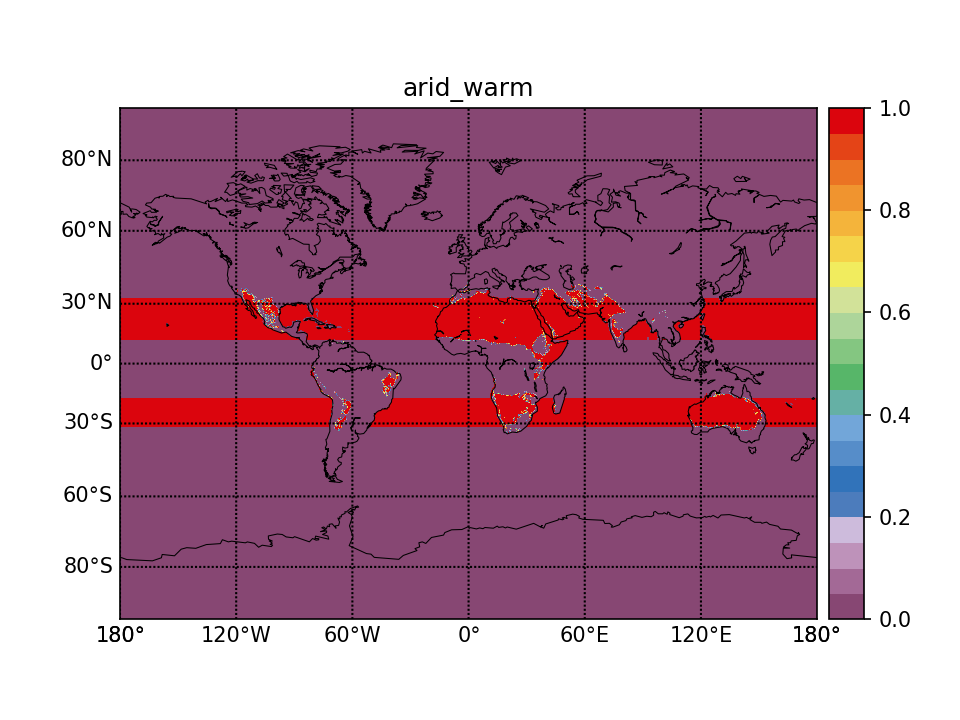
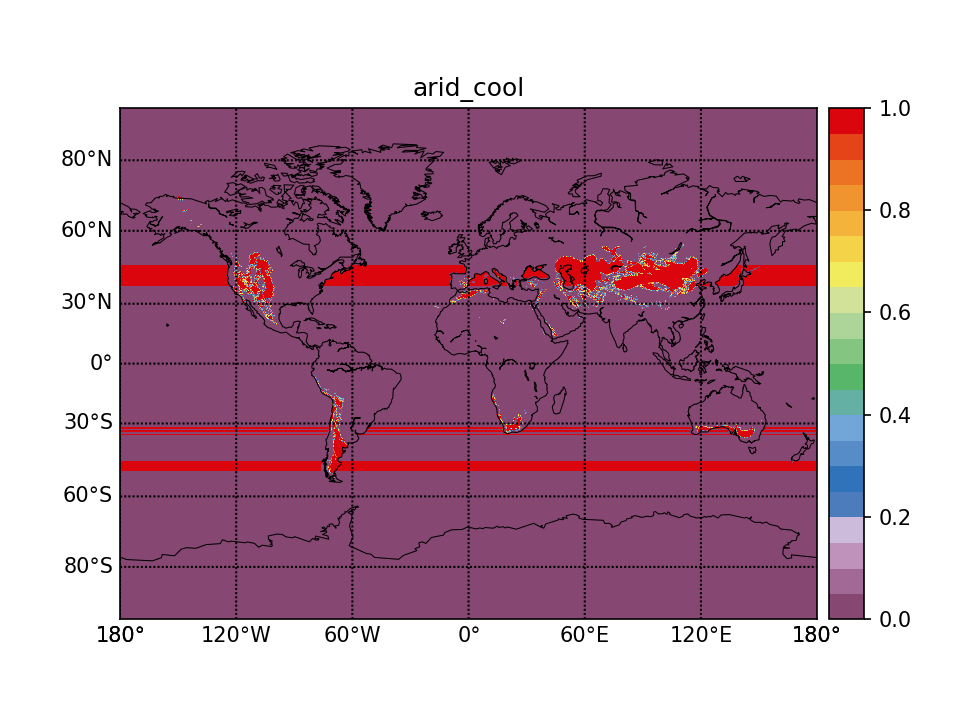
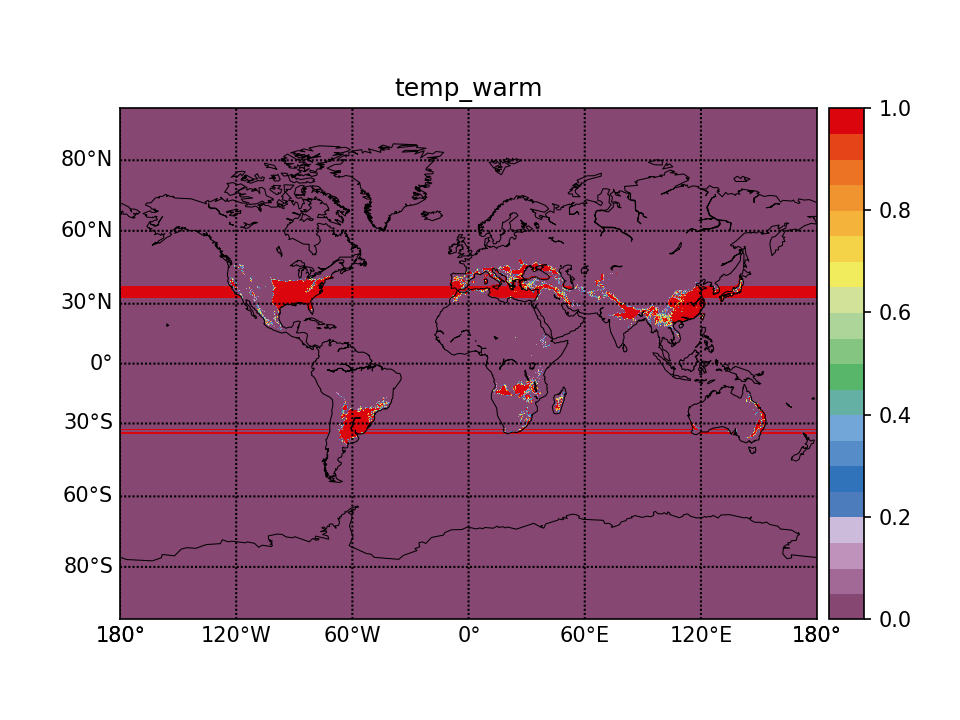
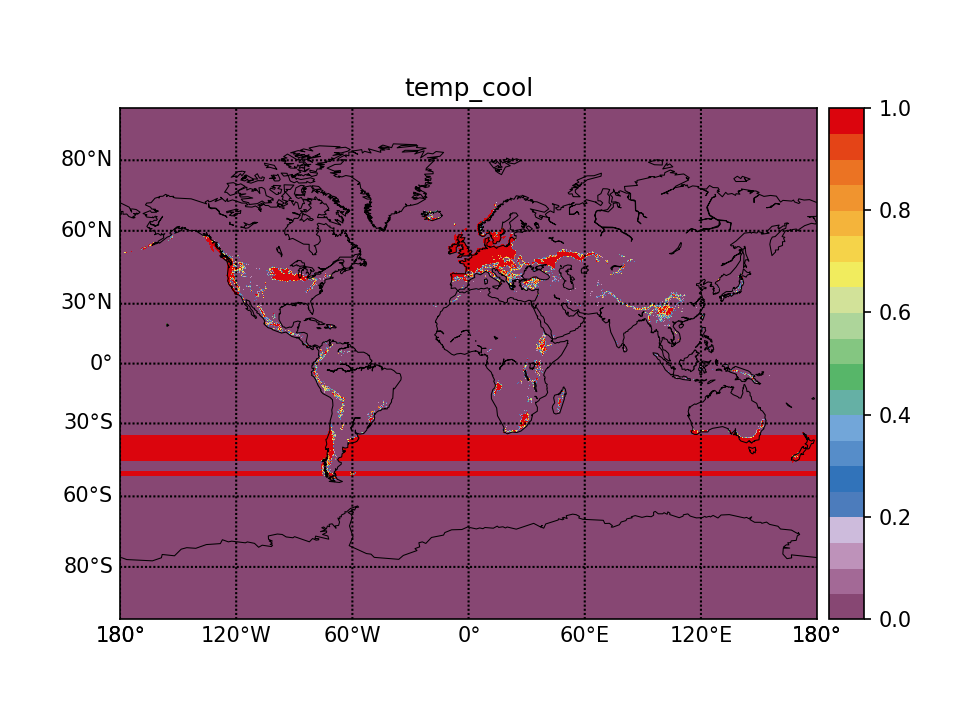
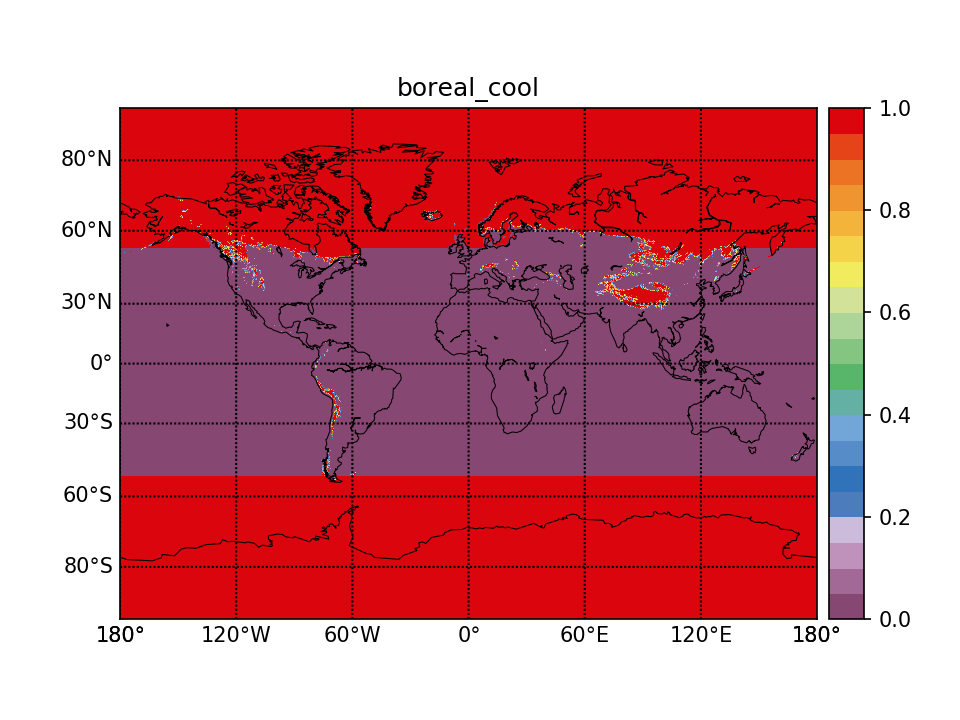
2b. Updated Köppen—Geiger climate map
| KG31 to KG7 | Af | Am | As | Aw | BSh | BSk | BWh | BWk | Cfa | Cfb | Cfc | Csa | Csb | Csc | Cwa | Cwb | Cwc | Dfa | Dfb | Dfc | Dfd | Dsa | Dsb | Dsc | Dsd | Dwa | Dwb | Dwc | Dwd | EF | ET |
| tropical | 1 | 1 | 1 | 1 | |||||||||||||||||||||||||||
| arid_warm | 1 | 1 | |||||||||||||||||||||||||||||
| arid_cool | 1 | 1 | |||||||||||||||||||||||||||||
| temp_warm | 1 | 1 | 1 | ||||||||||||||||||||||||||||
| temp_cool | 1 | 1 | 1 | 1 | 1 | 1 | 1 | ||||||||||||||||||||||||
| boreal_warm | 1 | 1 | 1 | 1 | 1 | ||||||||||||||||||||||||||
| boreal_cool | 1 | 1 | 1 | 1 | 1 | 1 | 1 | 1 |
 |
 |
 |
 |
 |
 |
 |
 |
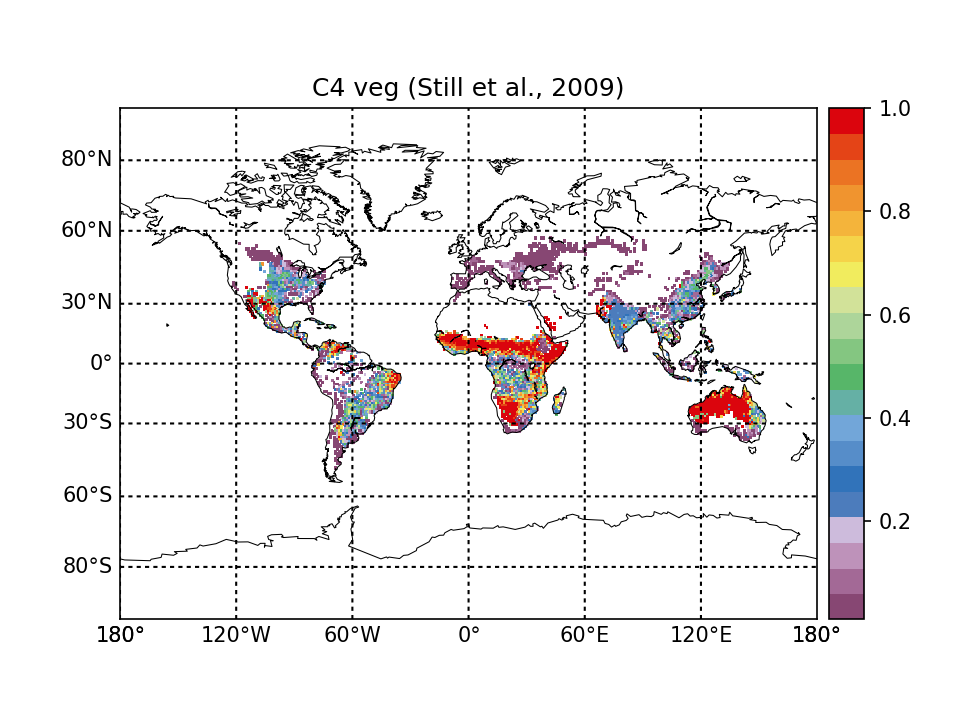
3. C4 vegetation map (C. Still et al. 2009)
The use of the Köppen—Geiger climate map results in the sharp transition between C3 and C4 vegetation. For this reason, a different map (at 0.5° resolution) from Still et al. (2009) has been used to distribute grasses and crops into different PFTs.
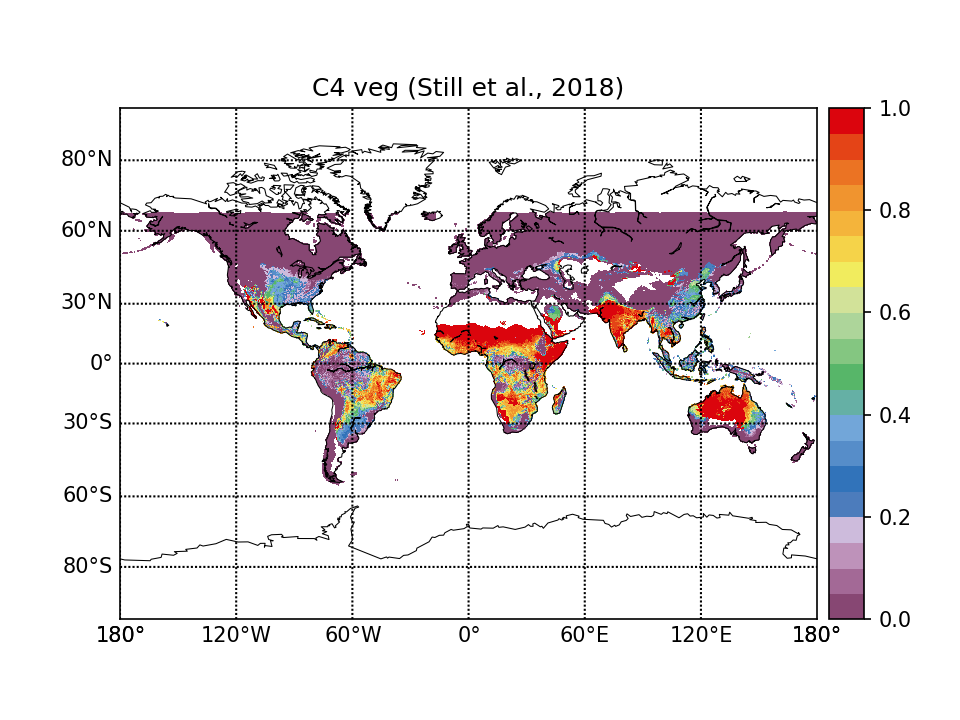
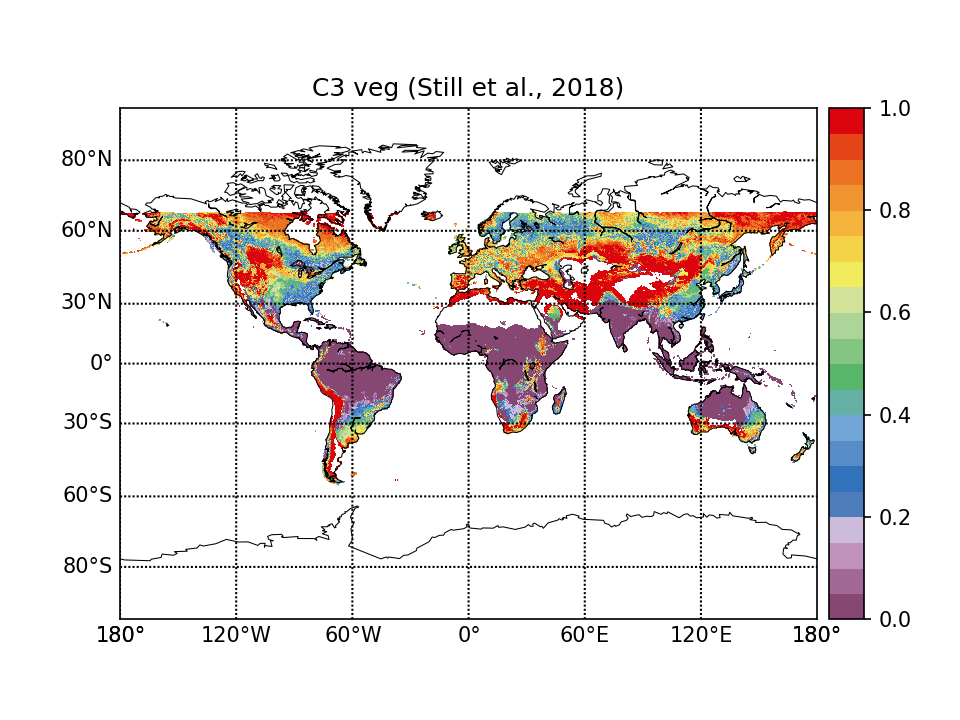
3b. Updated C4 vegetation map (C. Still et al. 2018)
An updated C3/C4 distribution product (at 1/6° resolution) from C. Still (2018) has been received.

4. Generic PFTs → ORCHIDEE PFTs
The following cross-walking table is used to combine generic PFTs into 13 standard ORCHIDEE PFTs.
| KG CLASS | TrBrEv | TrBrDe | TrNeEv | TrNeDe | ShBrEv | ShBrDe | ShNeEv | ShNeDe | NatGr | Crops | BS | Water | SnowIce | Urban | NoData |
| 1 (tropical) | PFT2 | PFT3 | PFT4 | PFT3 | PFT2 | PFT3 | PFT4 | PFT3 | PFT10 PFT11 using C4veg (Still) |
PFT12 PFT13 using C4veg (Still) |
PFT1 | PFT1 at land dillute between PFT2-13 at coast |
PFT1 | 80% → BS 20% → NatGr | PFT1 |
| 21 (temp warm) | PFT5 | PFT6 | PFT6 | PFT5 | PFT6 | PFT6 | |||||||||
| 22 (temp cool) | PFT9 | PFT9 | |||||||||||||
| 31 (boreal warm) | |||||||||||||||
| 32 (boreal cool) | PFT8 | PFT7 | PFT8 | PFT7 |
4b. Updated Generic PFTs → ORCHIDEE PFTs
The same cross-walking table as in section 4, but with slight attunements and established for 15 PFTs.
| TrBrEv | TrBrDe | TrNeEv | TrNeDe | ShBrEv | ShBrDe | ShNeEv | ShNeDe | NatGr | Crops | BS | Water | SnowIce | Urban | NoData | ||||
| Still-C3 | Still-C4 | LUH-C3 | LUH-C4 | Inland | Coast | |||||||||||||
| KG Tropical | PFT2 | PFT3 | PFT4 | PFT3 | PFT2 | PFT3 | PFT4 | PFT3 | PFT14 | PFT11 | PFT12 | PFT13 | PFT1 | PFT1 | Dillute between existing PFTs | PFT1 | 80% → BS 20% → NatGr | PFT1 |
| KG Arid Warm | ||||||||||||||||||
| KG Arid Cool | PFT5 | PFT6 | PFT6 | PFT5 | PFT6 | PFT6 | PFT10 | |||||||||||
| KG Temperate Warm | ||||||||||||||||||
| KG Temperate Cool | PFT9 | PFT9 | ||||||||||||||||
| KG Boreal Warm | PFT7 | PFT7 | PFT15 | |||||||||||||||
| KG Boreal Cool | PFT8 | PFT7 | PFT8 | PFT7 | ||||||||||||||
| ORCHIDEE PFTs |
Forest | Grass | Crop | |||||
| Broadleaf | Needleleaf | C3 | C4 | C3 | C4 | |||
| Deciduous | Evergreen | Deciduous | Evergreen | |||||
| Tropical | PFT3 | PFT2 | PFT3 | PFT4 | PFT14 | PFT11 | PFT12 | PFT13 |
| Temperate | PFT6 | PFT5 | PFT6 | PFT4 | PFT10 | |||
| Boreal | PFT8 | PFT7 | PFT9 | PFT7 | PFT15 | |||
5. Merge with LUH
The LUH dataset has the following structure:
| LUH CLASS | Description | Transition | to primf | to primn | to secdf | to secdn | to urban | to c3ann | to c4ann | to c3per | to c4per | to c3nfx | to pastr | to range | |
| primf | forested primary land | primf | |||||||||||||
| primn | non-forested primary land | primn | |||||||||||||
| secdf | potentially forested secondary land | secdf | |||||||||||||
| secdn | potentially non-forested secondary land | secdn | |||||||||||||
| urban | urban land | urban | |||||||||||||
| c3ann | C3 annual crops | c3ann | |||||||||||||
| c4ann | C4 annual crops | c4ann | |||||||||||||
| c3per | C3 perennial crops | c3per | |||||||||||||
| c4per | C4 perennial crops | c4per | |||||||||||||
| c3nfx | C3 nitrogen-fixing crops | c3nfx | |||||||||||||
| pastr | managed pasture | pastr | |||||||||||||
| range | rangeland | range |
For the merge with the LUH dataset covering 850-2100 the single ORCHIDEE PFT map for 2010 is used. LUH data are joined into 4 groups:
LUHNAT = LUHPRIMF + LUHPRIMN + LUHSECDF + LUHSECDN + LUHRANGE + LUHURBAN
LUHC3 = LUHC3ANN + LUHC3PER + LUHC3NFX
LUHC4 = LUHC4ANN + LUHC4PER
LUHPASTR
The C3/C4 crops and pasture data are directly imposed from LUH (LUH crops are put to ORC crops, LUH pasture is put to ORC grasses), other LUH classes are distributed to ORCHIDEE PFTs using the present-day fractioning calculated from 2010. As grasses are only partly represented by pasture, for the rest grasses part we calculate the difference ORCgrass+ORCcrop-LUHC3-LUHC4-Pastr, and this portion is used to define the residual present-day fraction of grasses. Overall calculation of the present-day fractioning of natural vegetation (i.e. sum of LUH classes excluding crops and pasture) between ORCHIDEE PFTs is done in the following way:
LUHANT = LUHC3 + LUHC4 + LUHPASTR
GRASSANT = max(0, LUHANT – ORC12 – ORC13)
GRASSNAT = max(0, ORC10 + ORC11 – GRASSANT)
GRASSNAT_C3 = GRASSNAT · ORC10 / (ORC10 + ORC11)
GRASSNAT_C4 = GRASSNAT · ORC11 / (ORC10 + ORC11)
TOTALNAT = ORC1 + ... + ORC9 + GRASSNAT_C3 + GRASSNAT_C4
f1 = ORC1 / TOTALNAT
...
f9 = ORC9 / TOTALNAT
f10 = GRASSNAT_C3 / TOTALNAT
f11 = GRASSNAT_C4 / TOTALNAT
Then for each particular year of backward/forward reconstruction the ORCHIDEE PFTs are obtained by splitting the LUH data with respect to the pre-calculated fractions:
PFT1 = f1 · LUHNAT
...
PFT9 = f9 · LUHNAT
PFT10 = f10 · LUHNAT + StillC3 · LUHPASTR
PFT11 = f11 · LUHNAT + StillC4 · LUHPASTR
PFT12 = LUHC3
PFT13 = LUHC4
| Last modified: 24/05/2025 09:21:24 |
| ← Description | CCI classes → |