


| | | | |||
| orchidas : dev / Divers / Negative NPP SBG | Site Map |
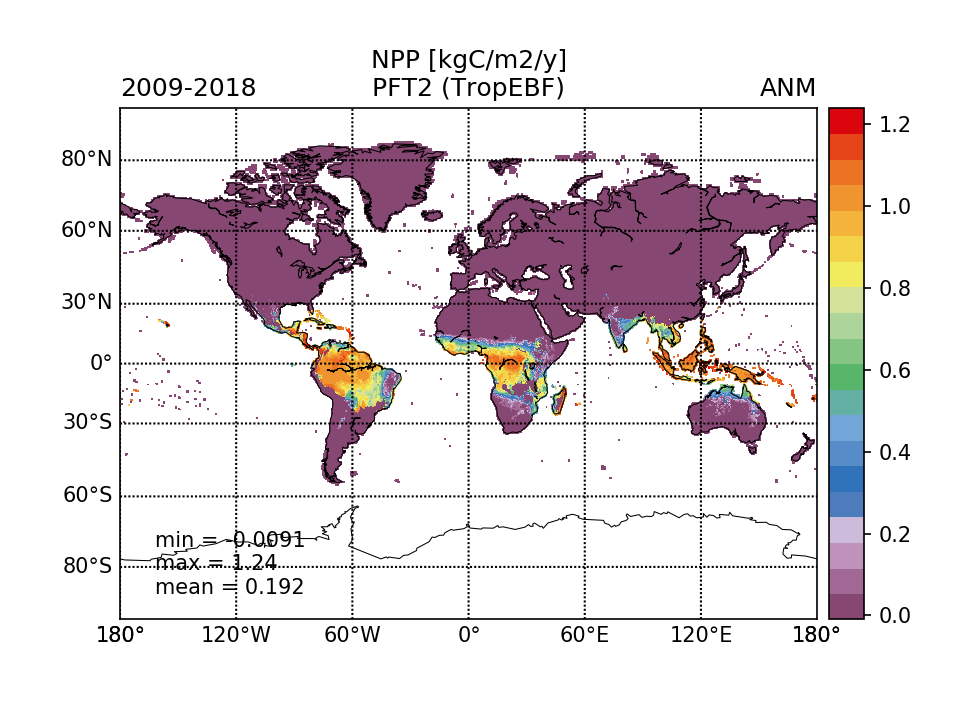
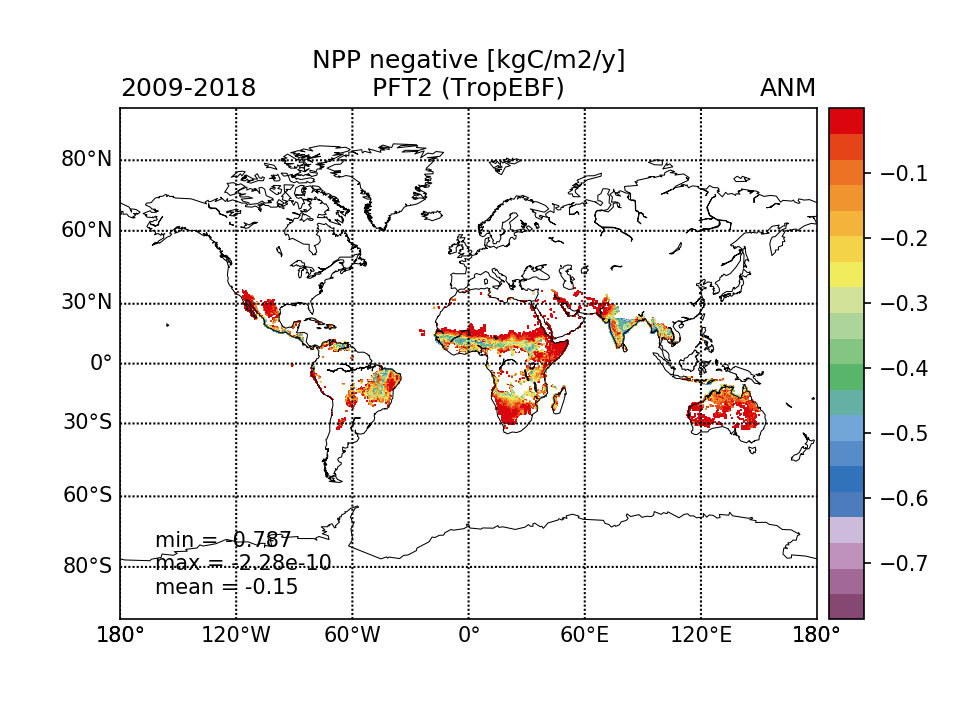
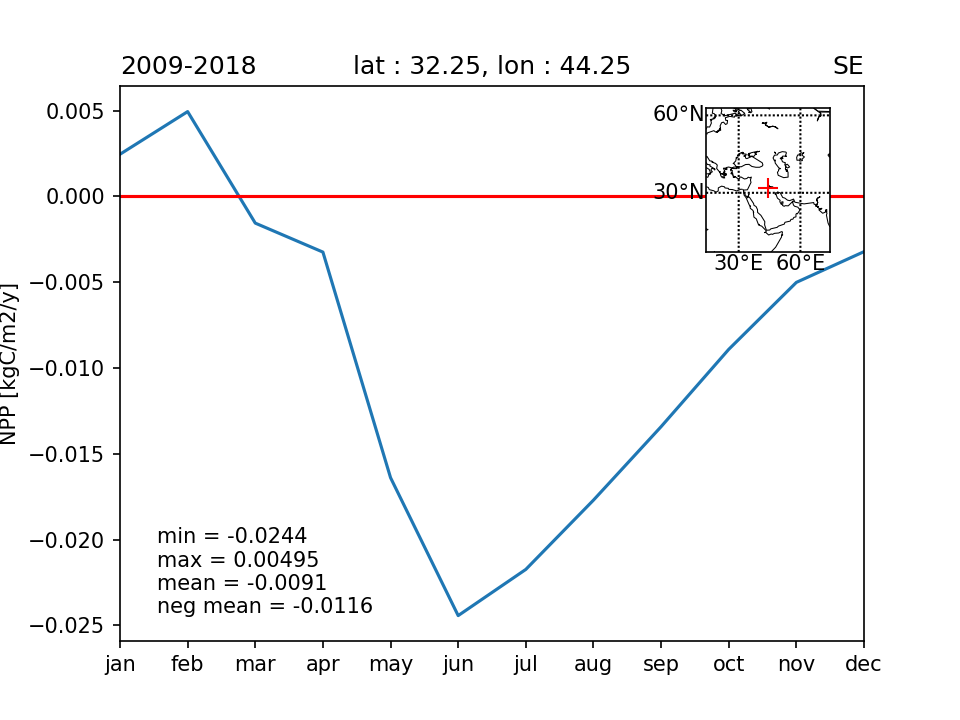
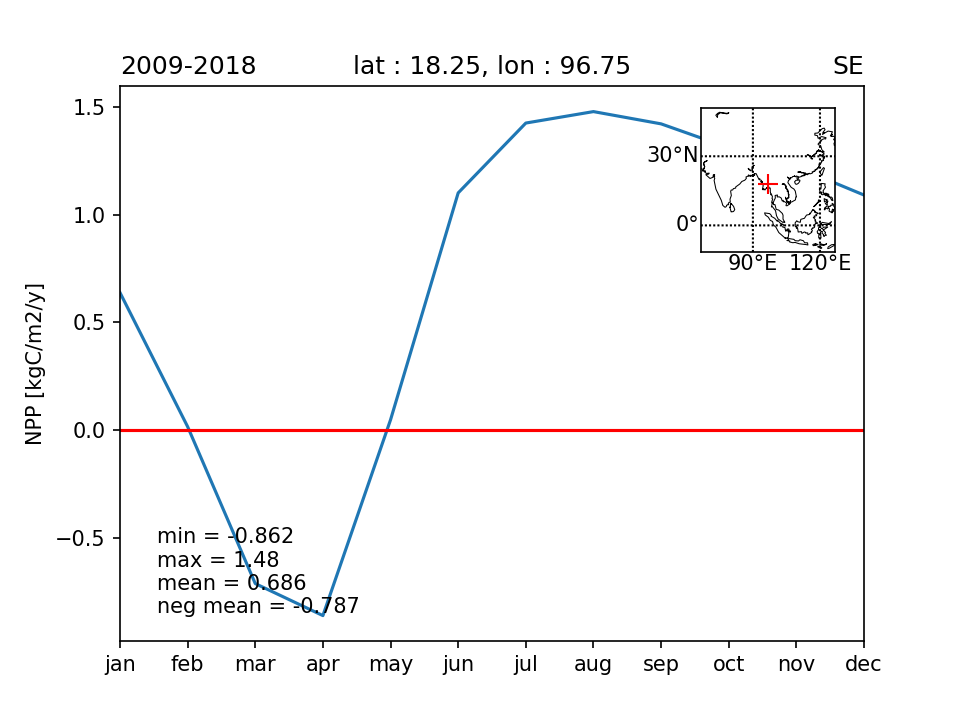
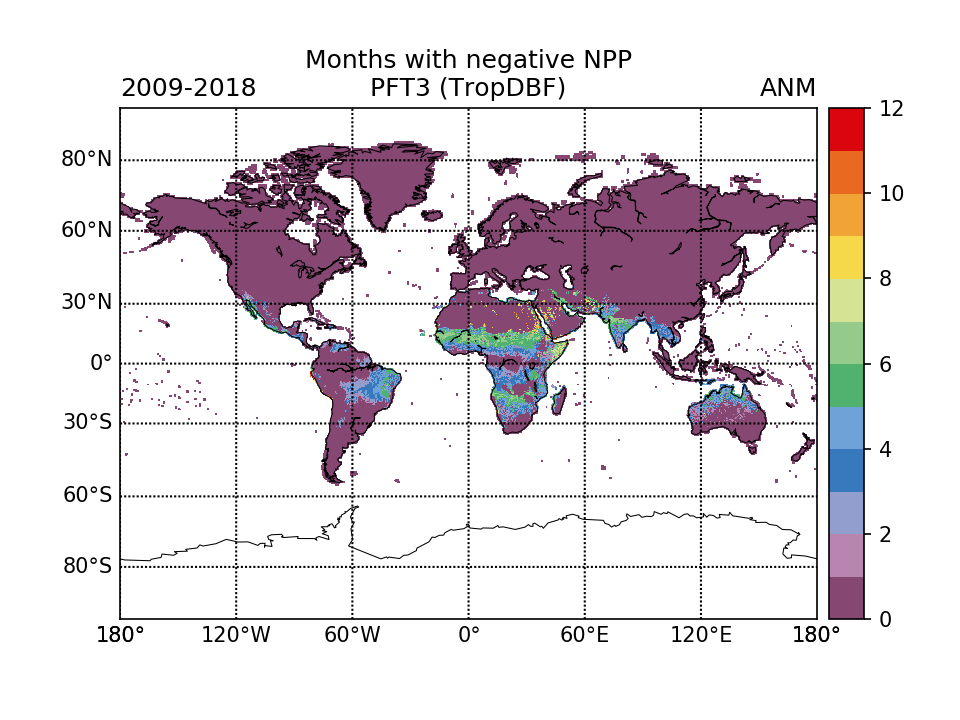
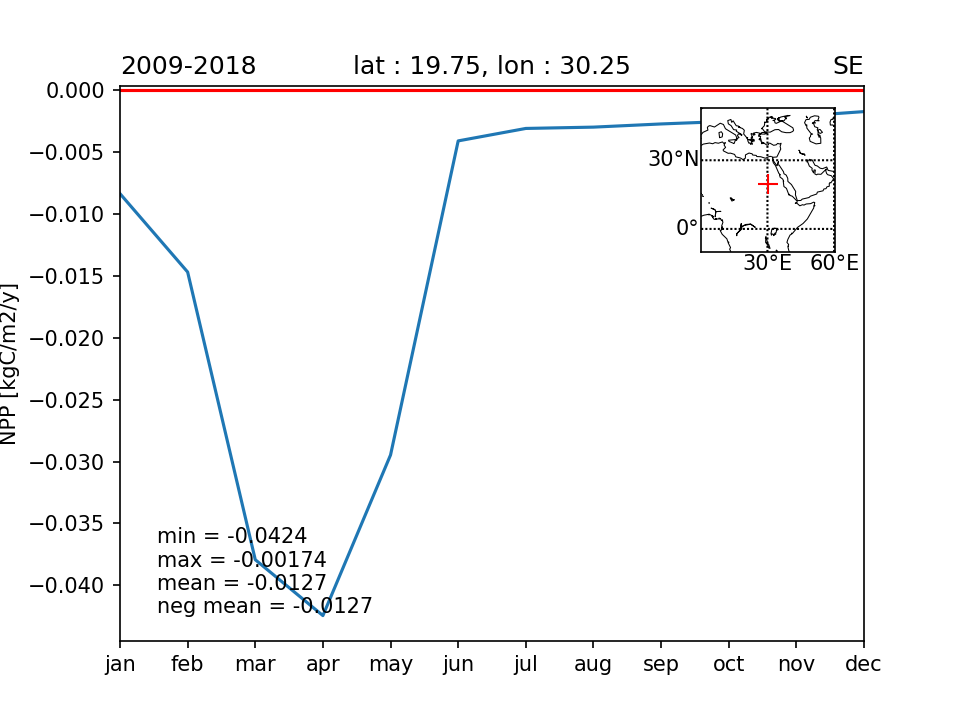
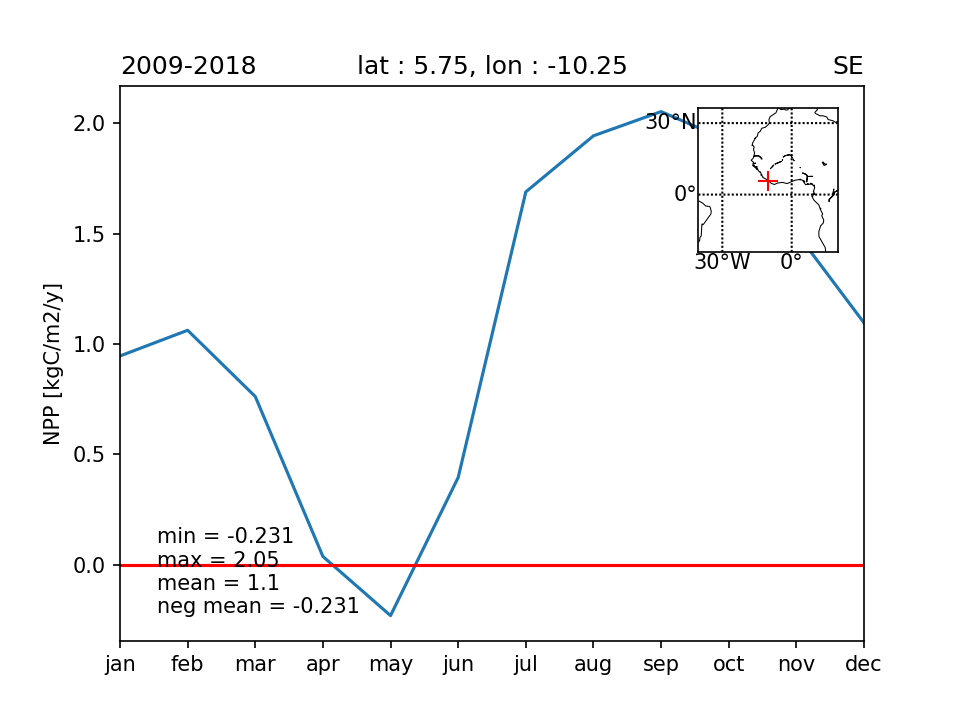
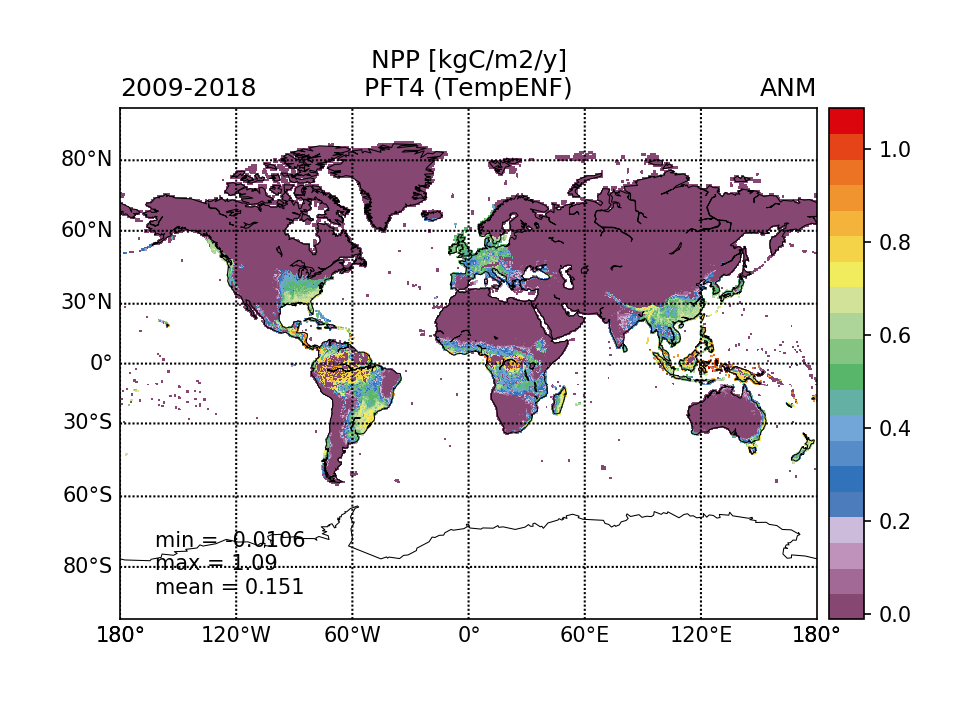
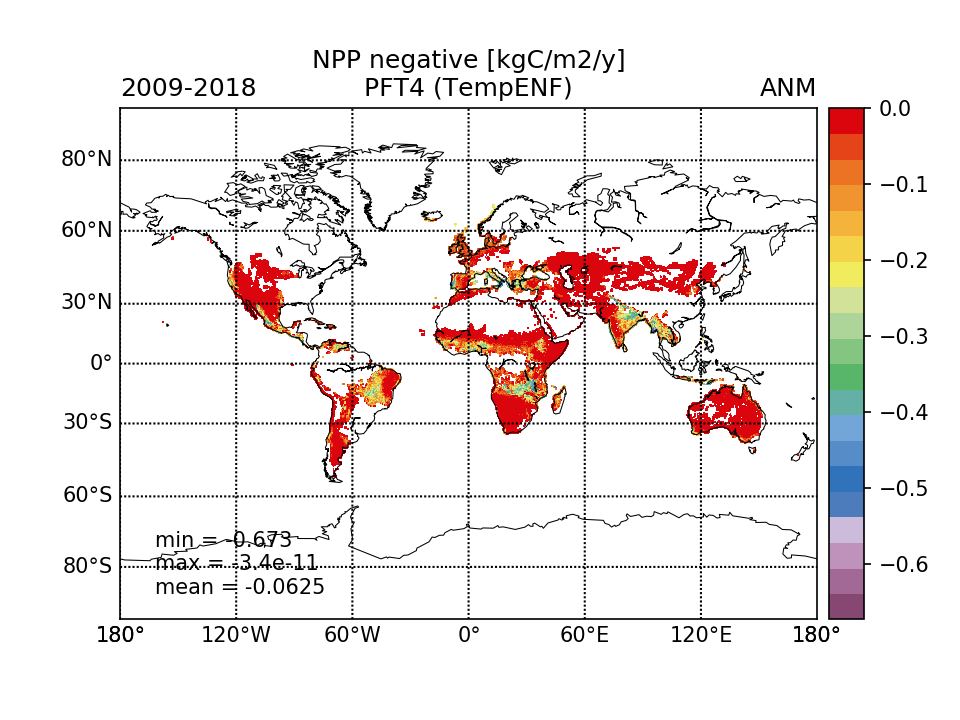
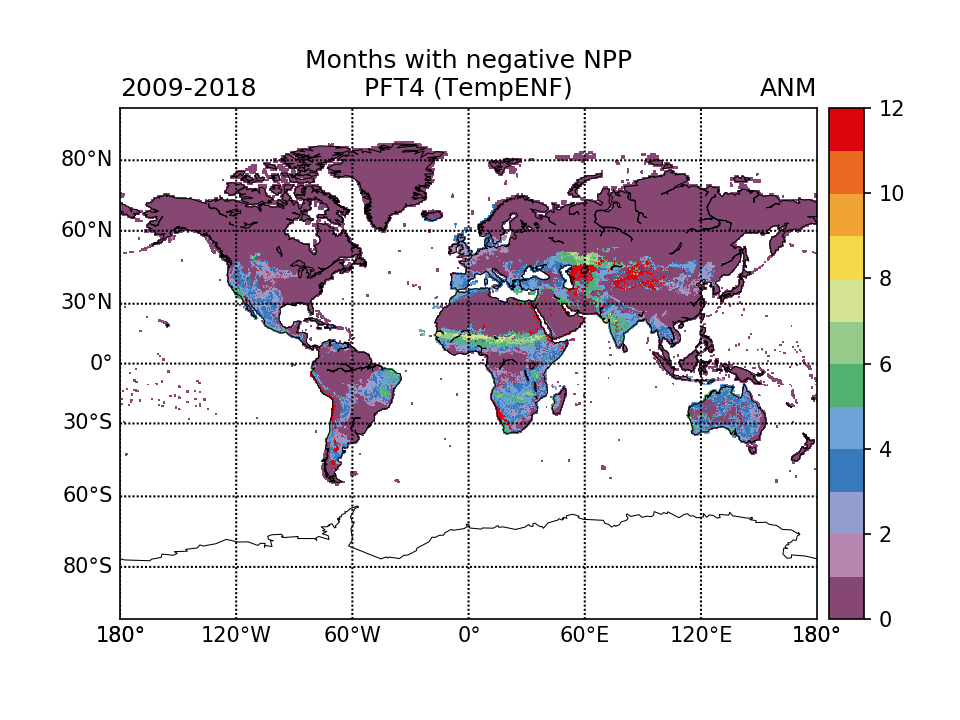
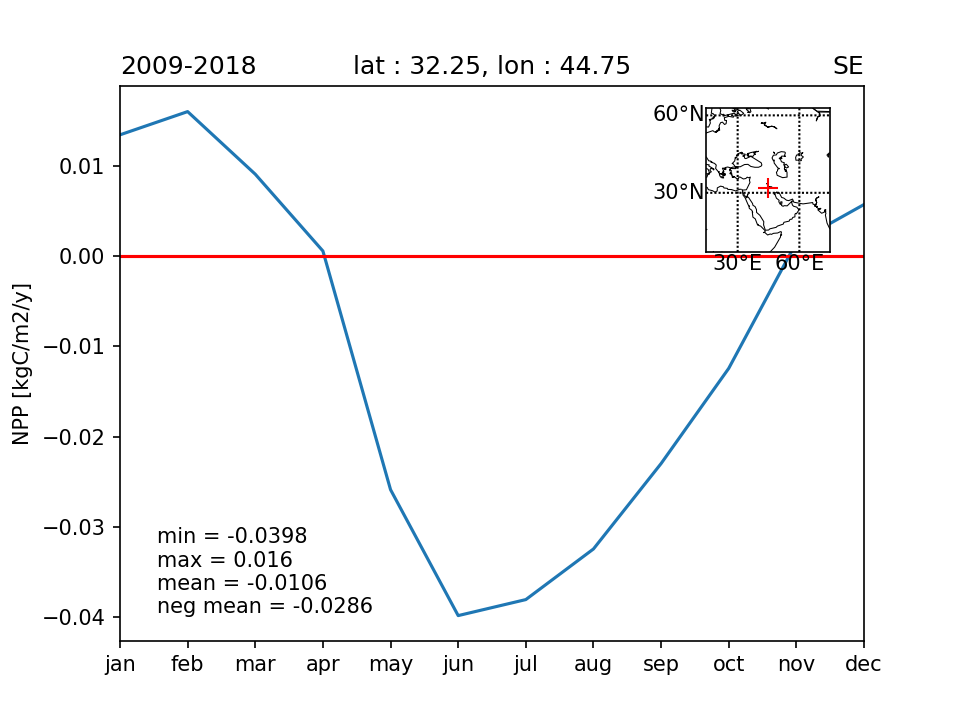
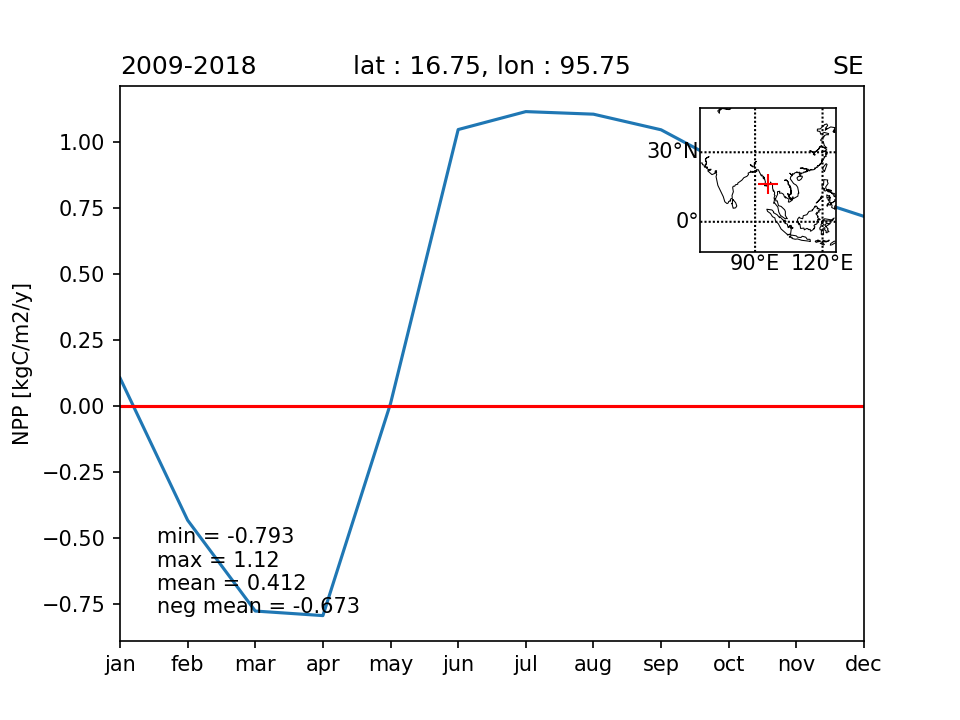
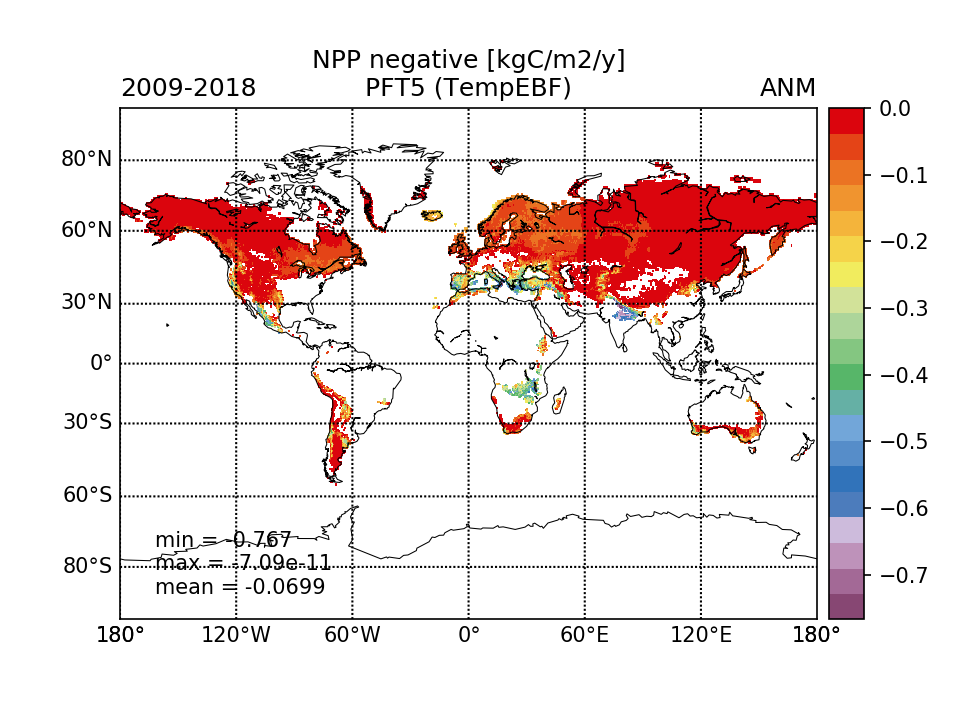
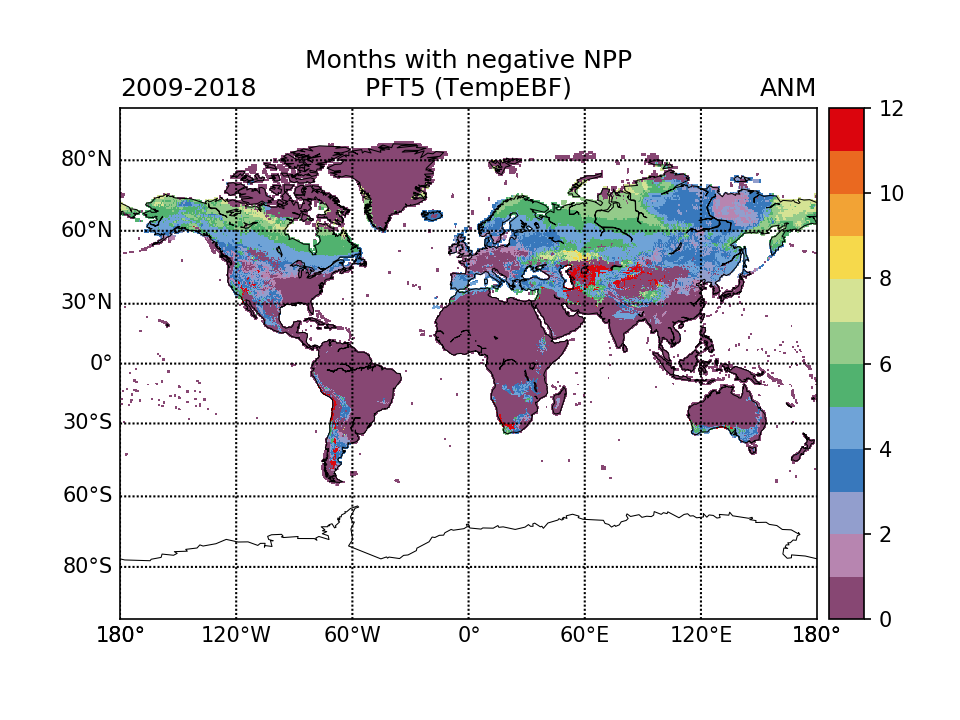
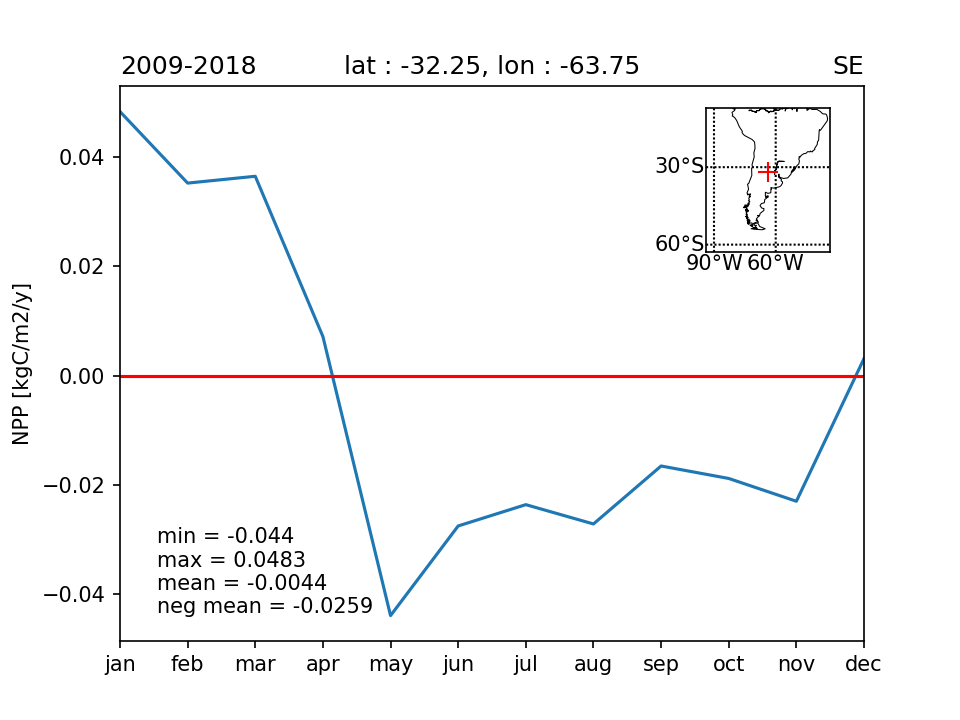
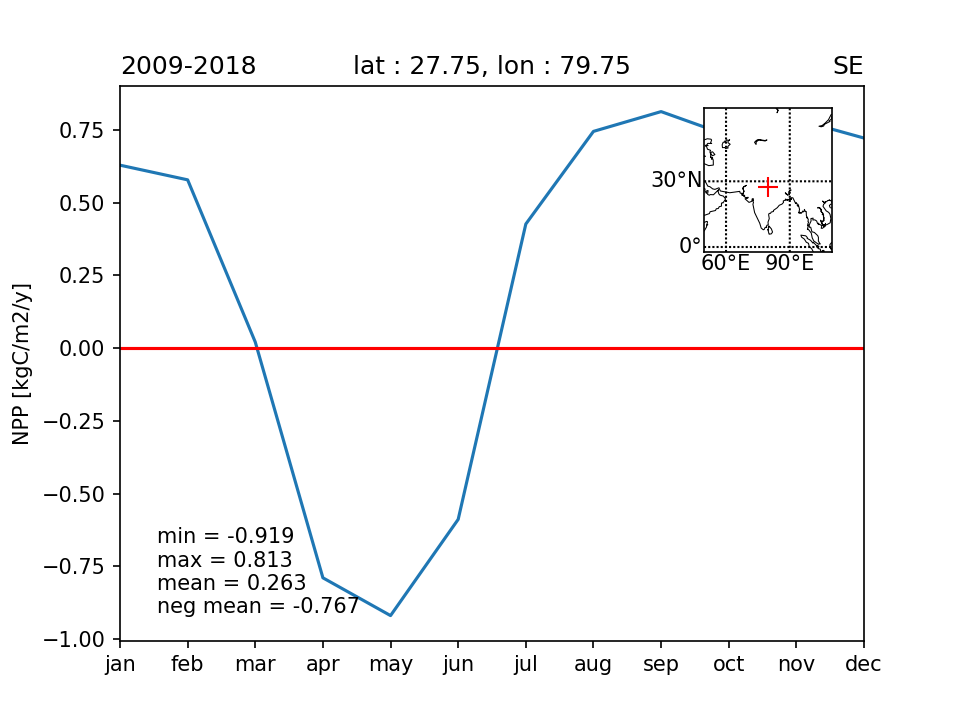
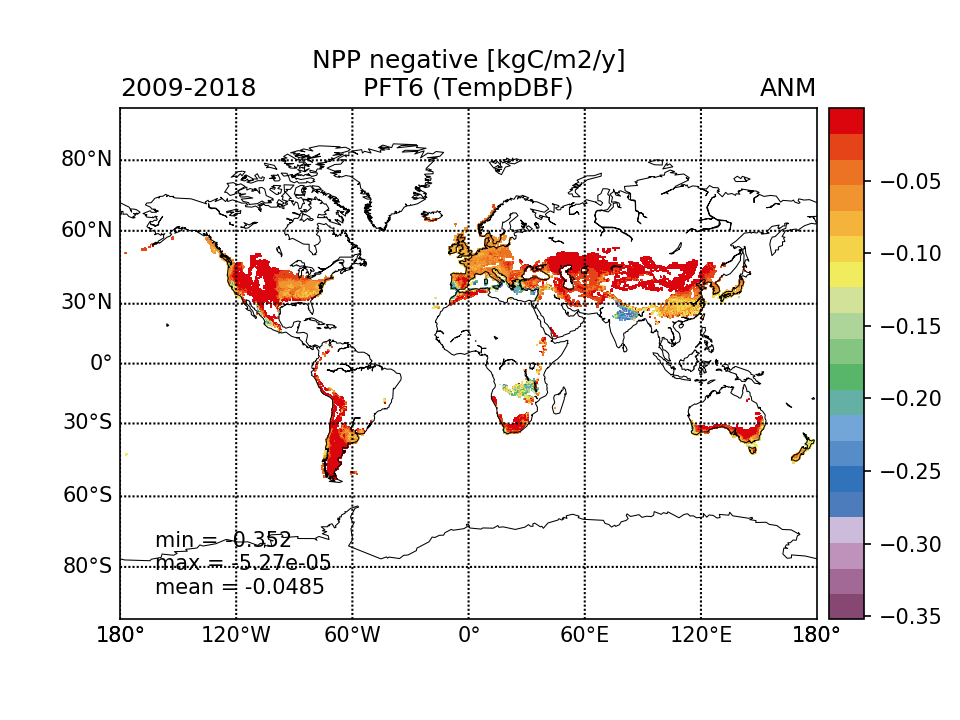
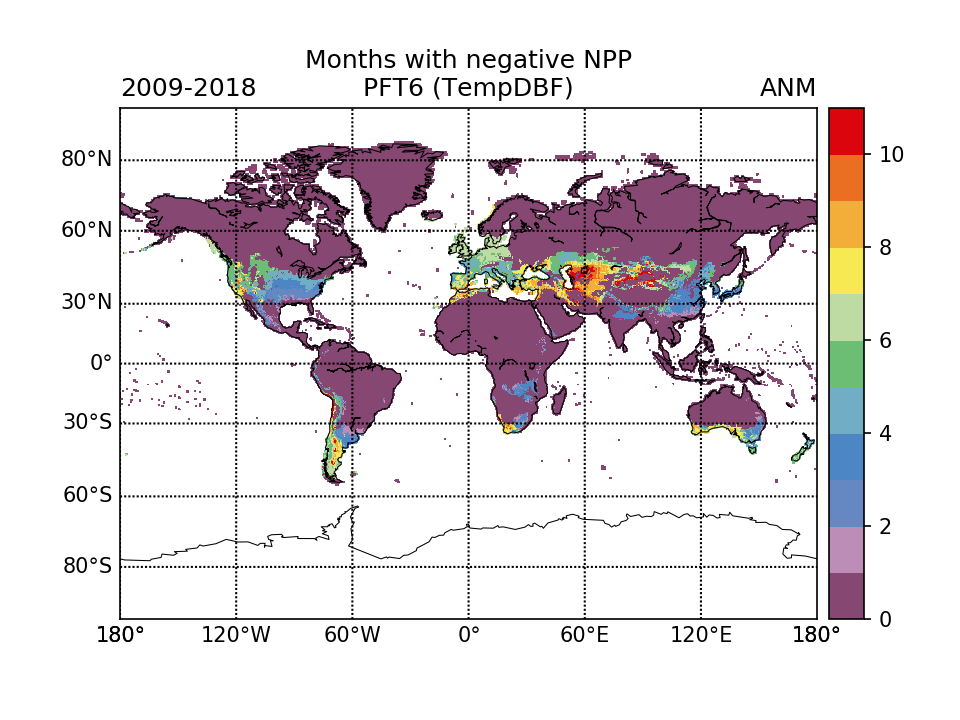
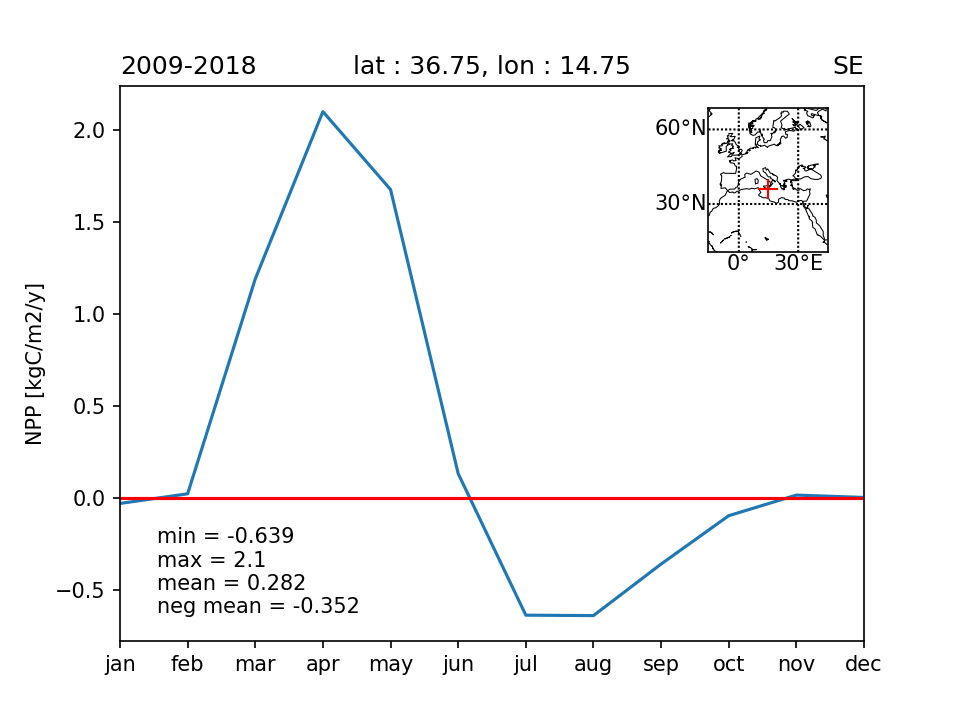
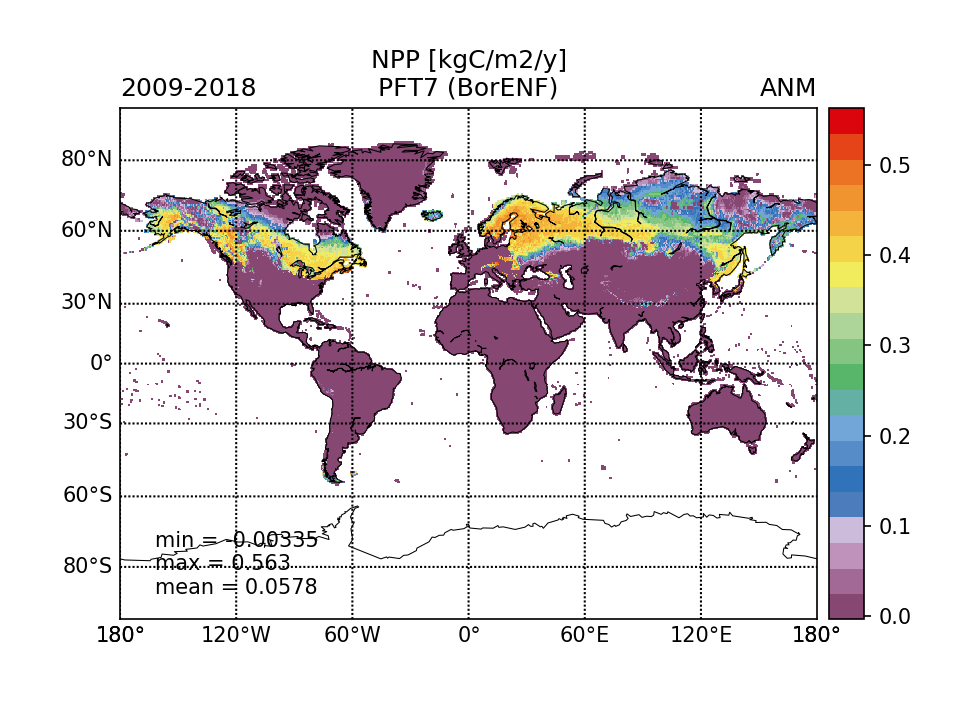
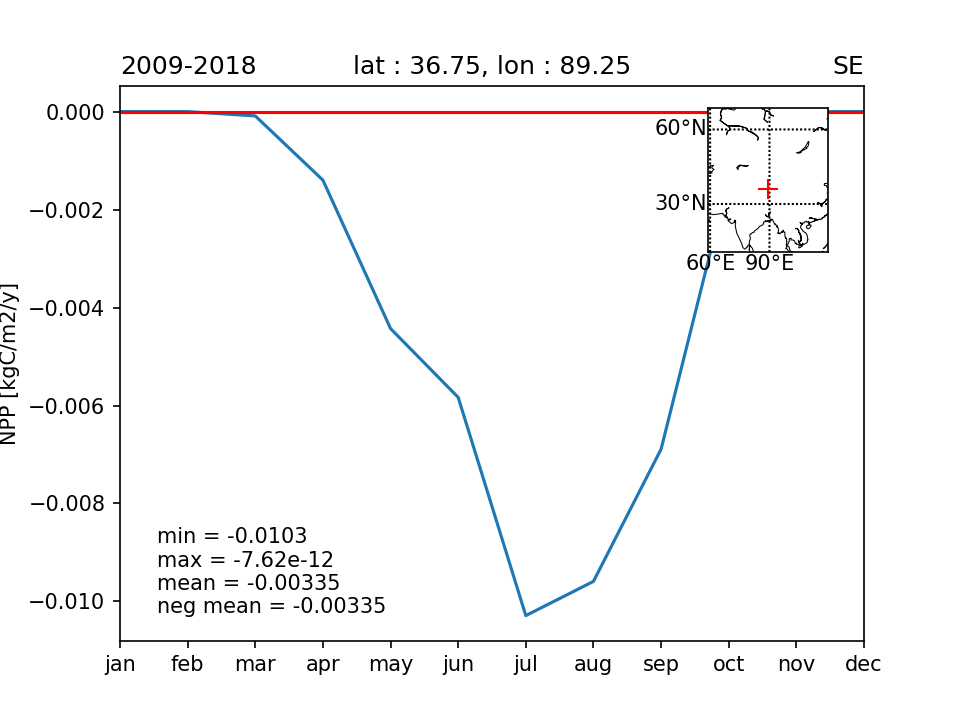
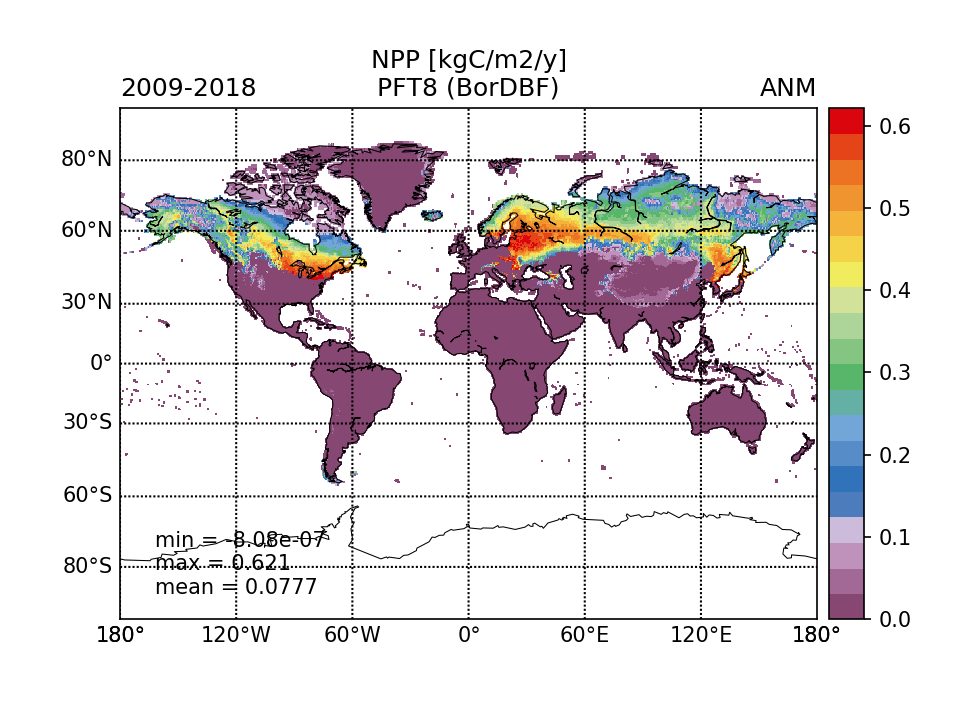
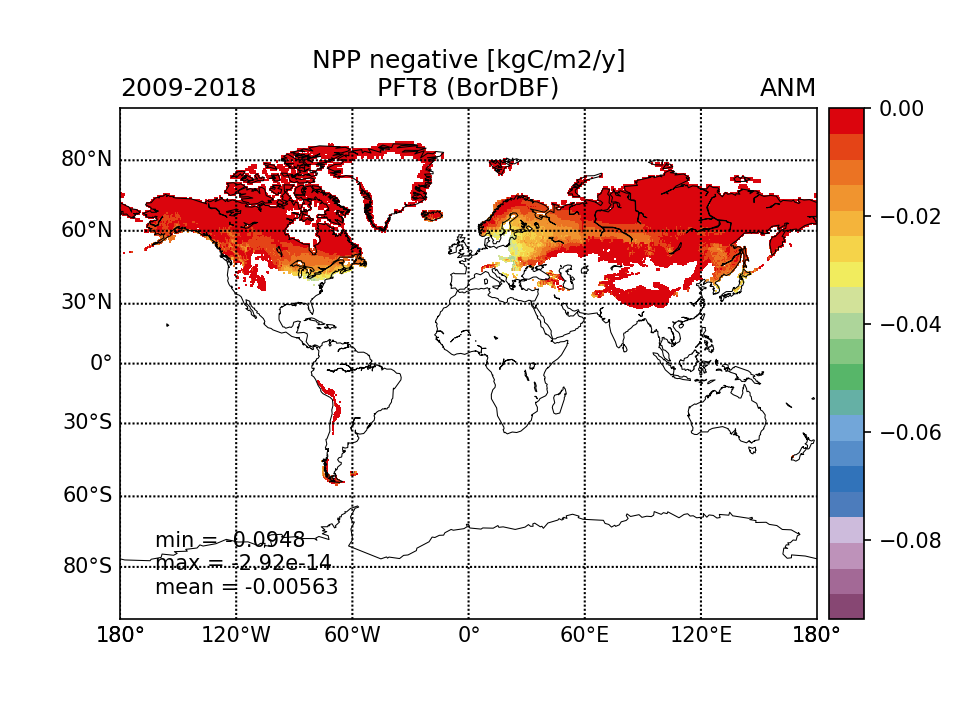
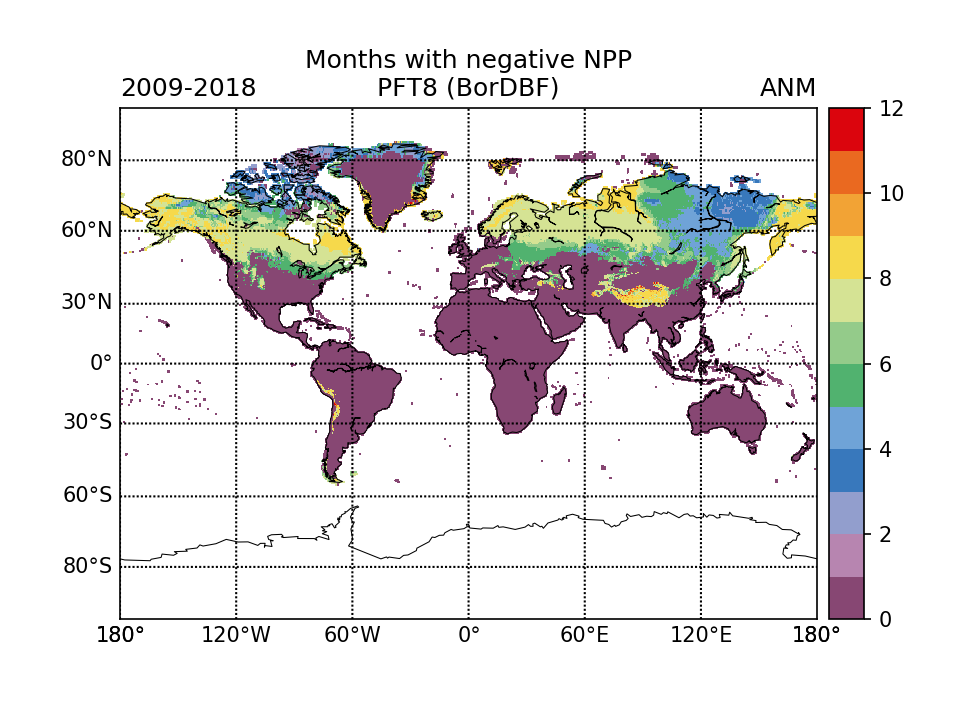
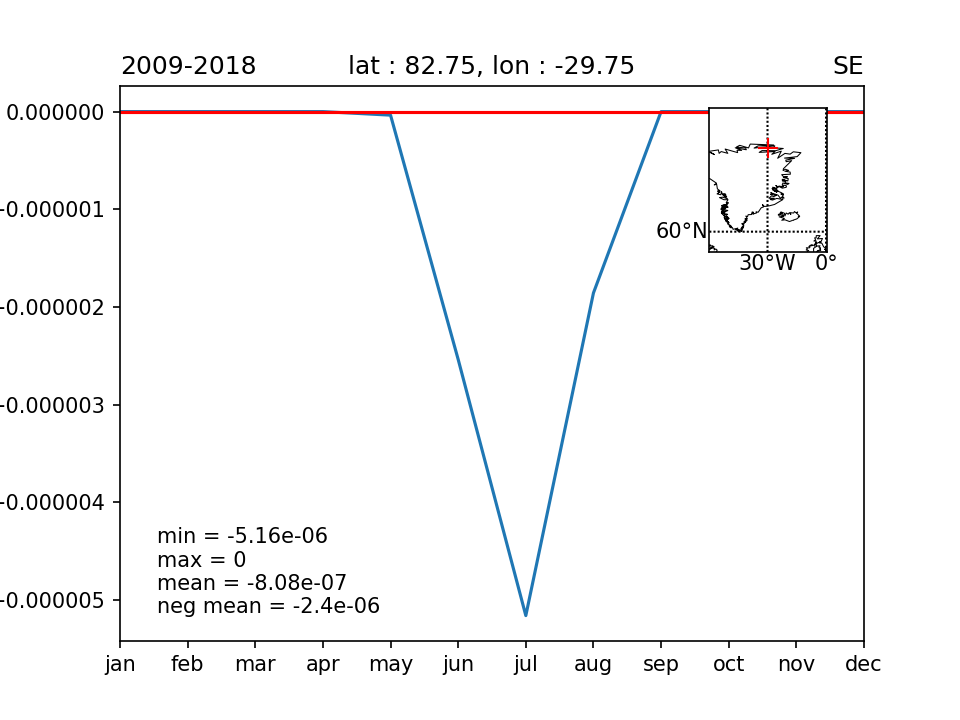
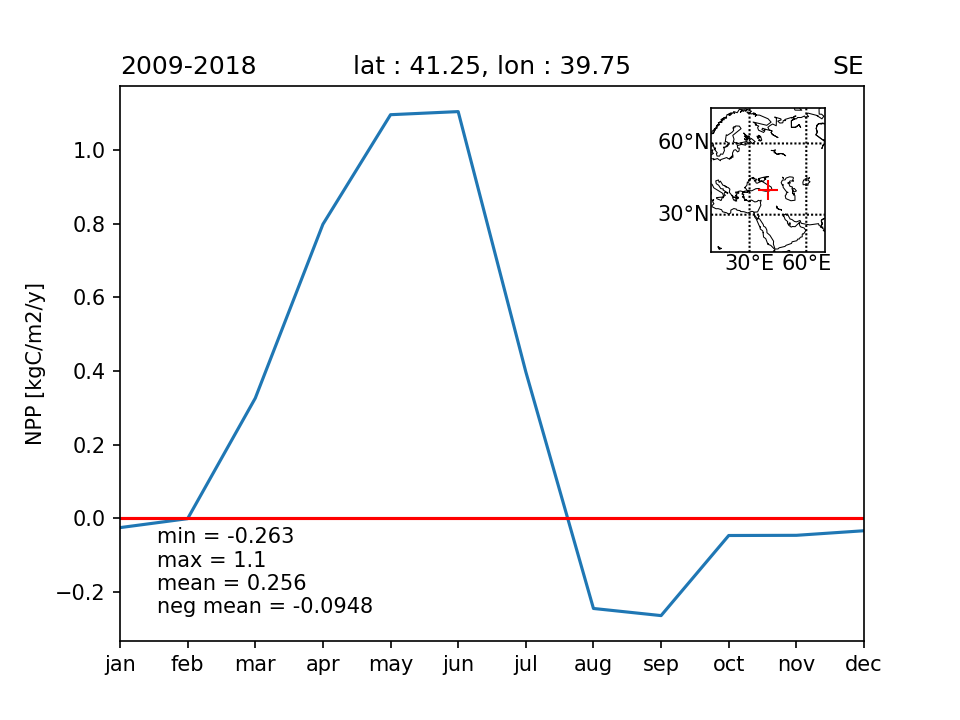
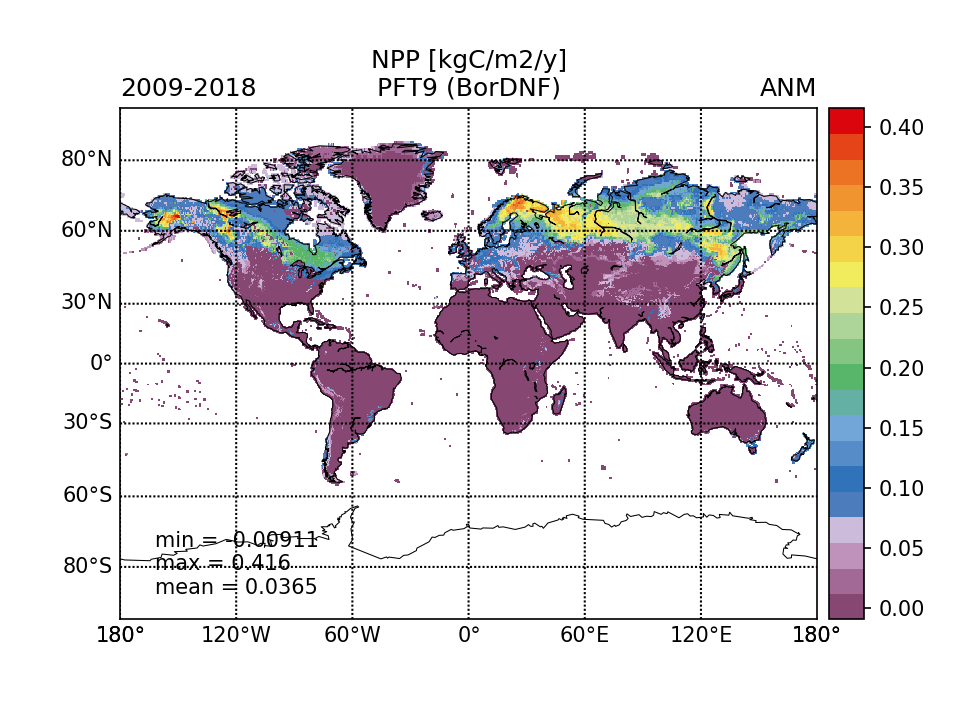
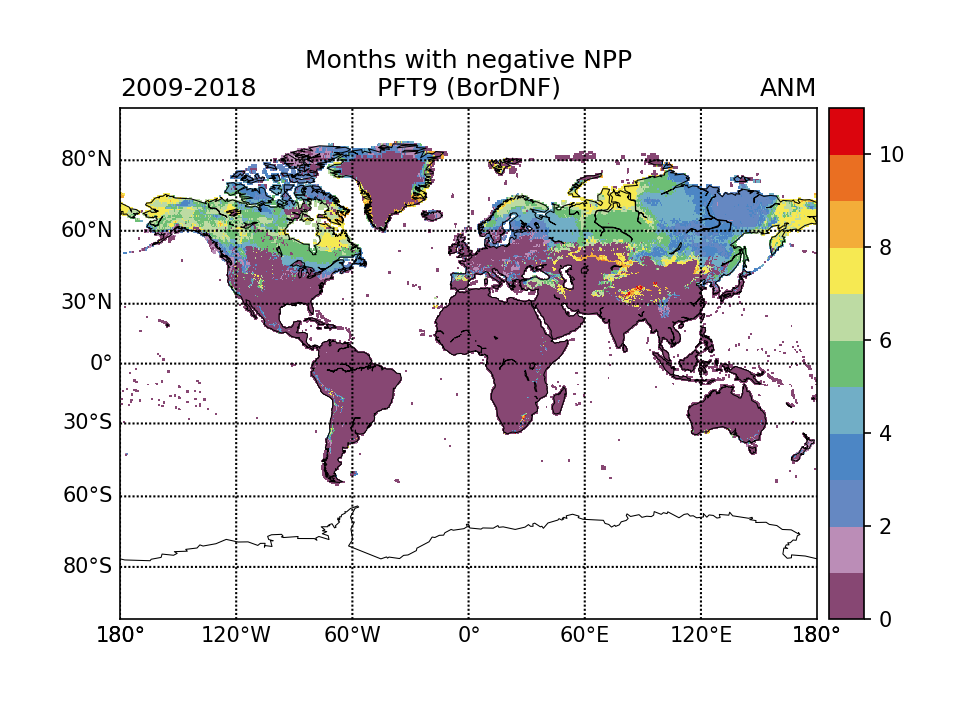
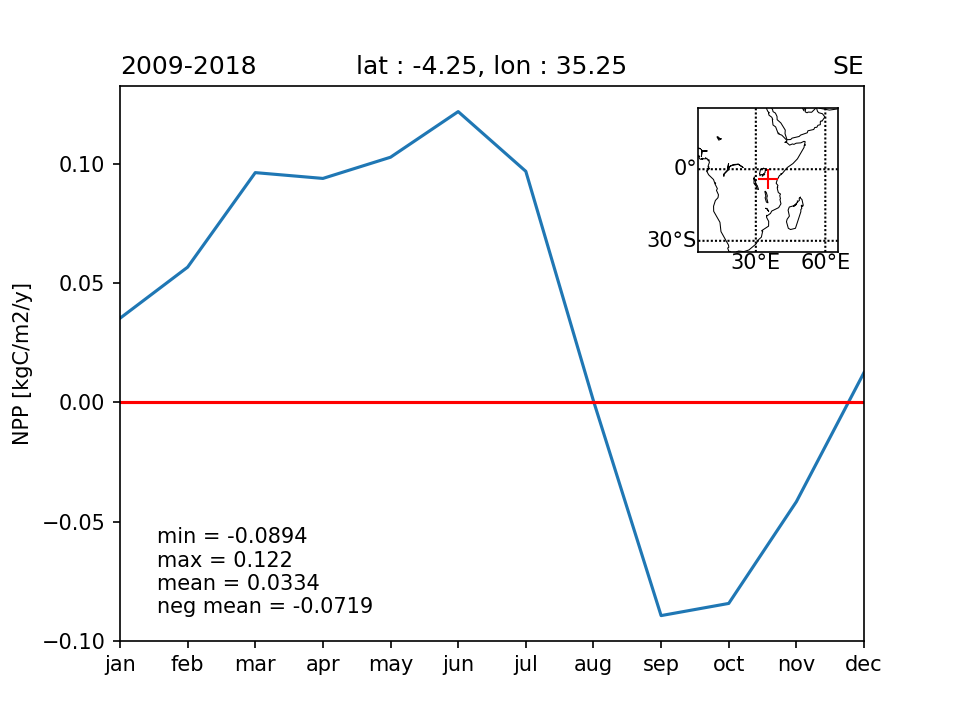
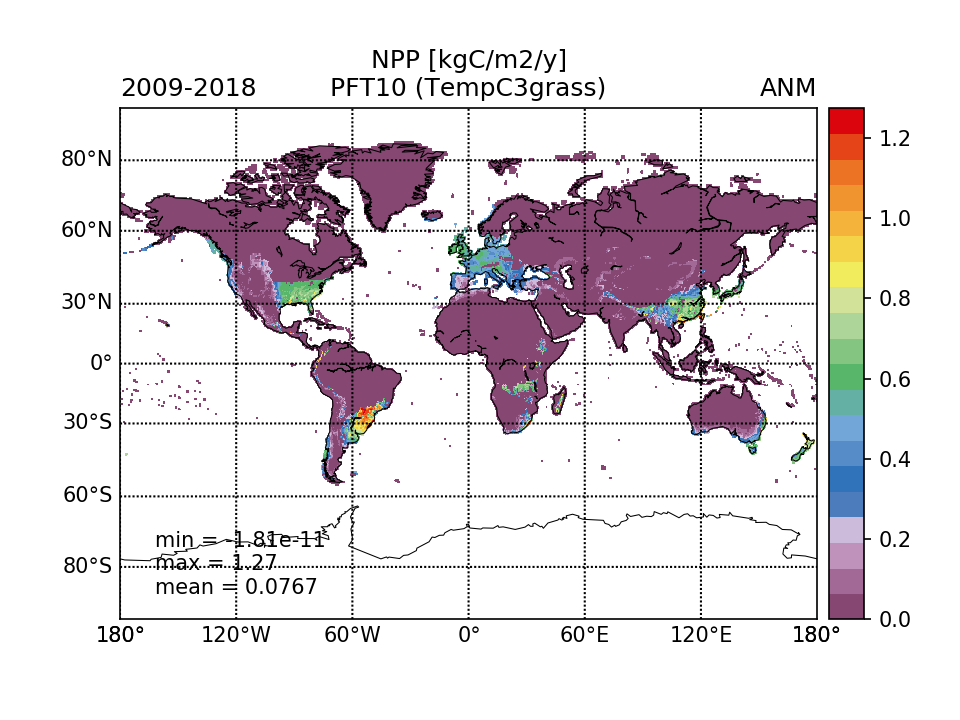
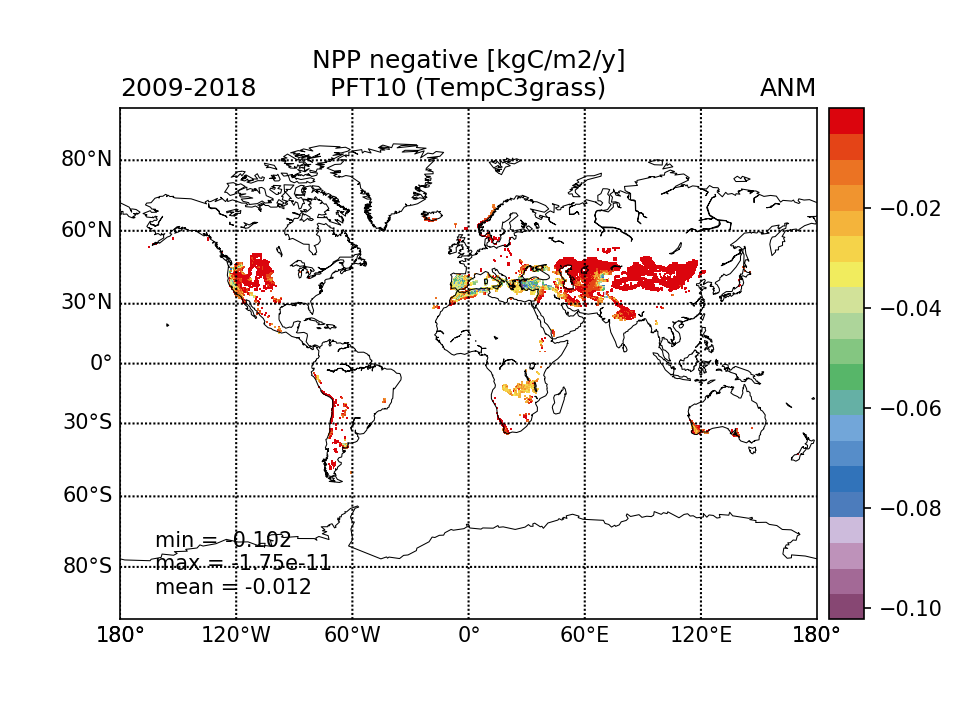
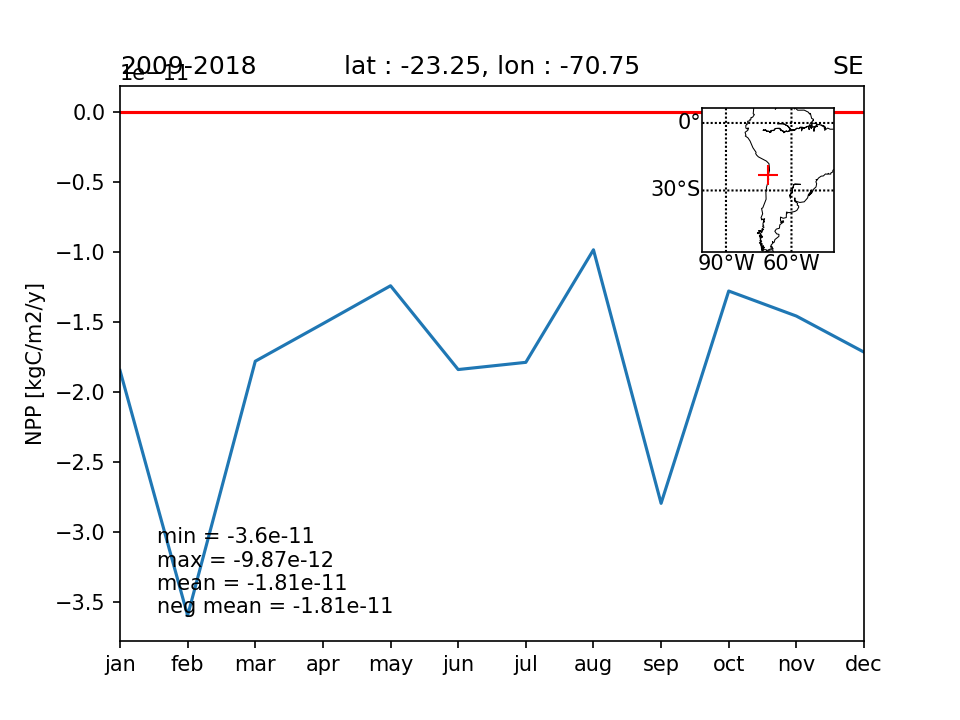
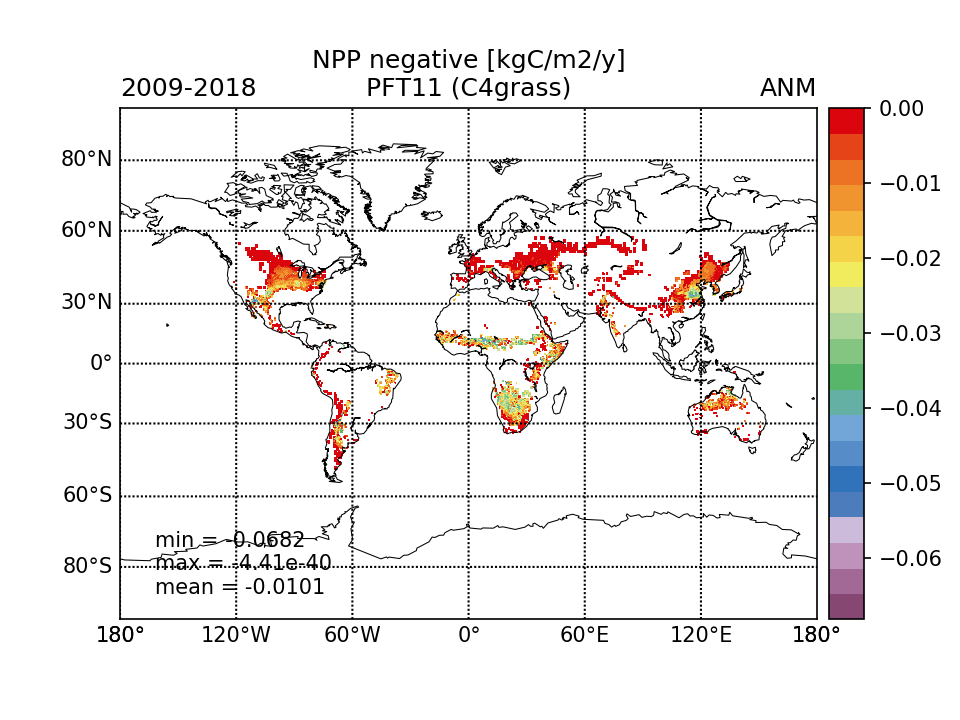
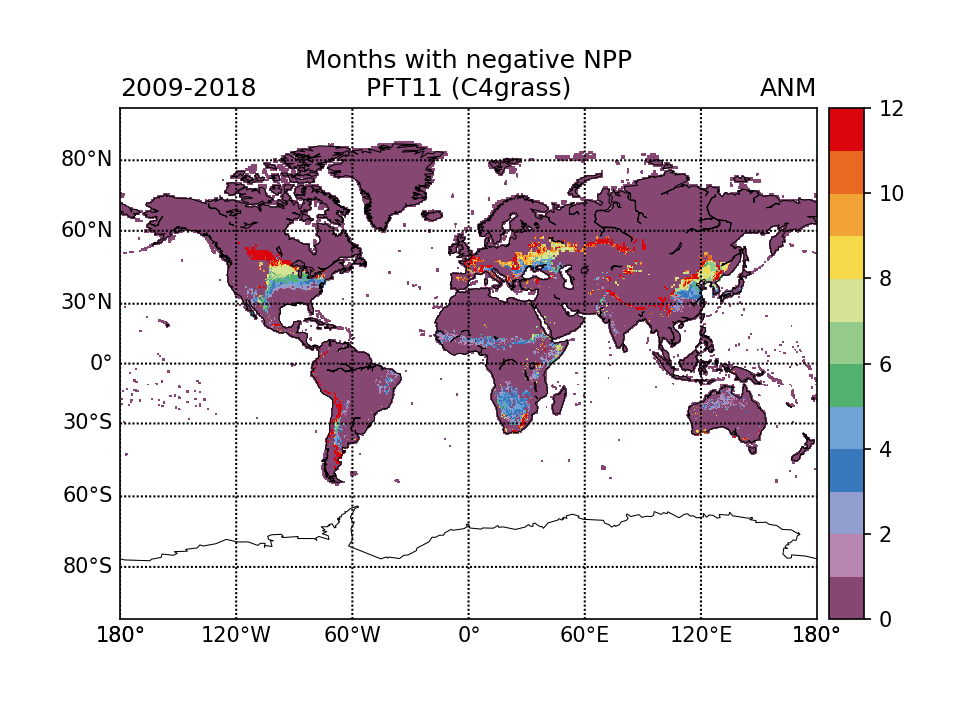
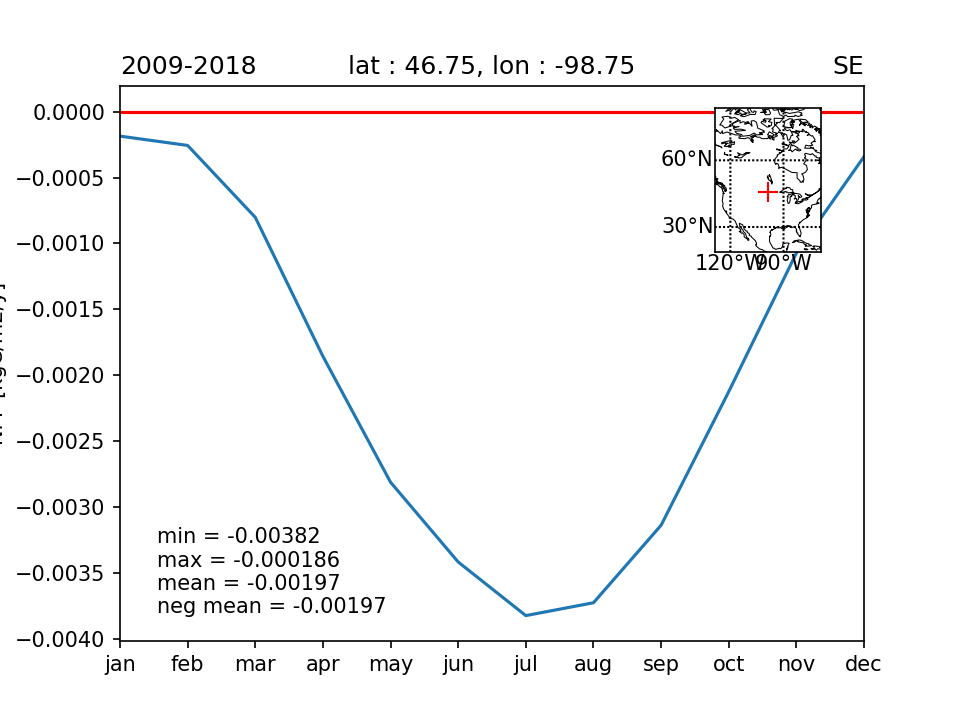
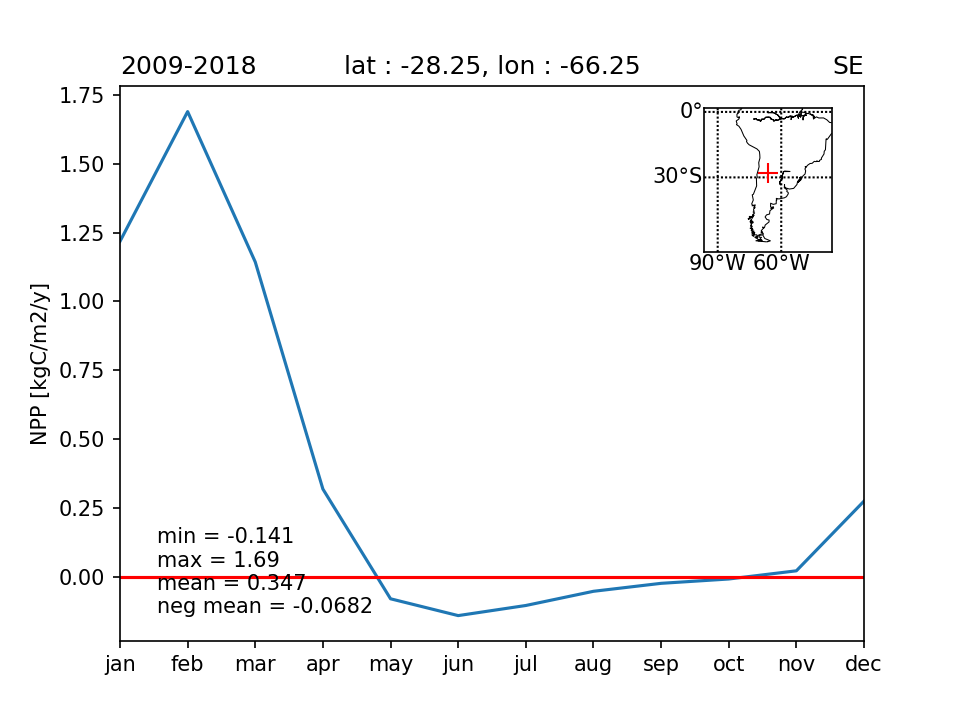
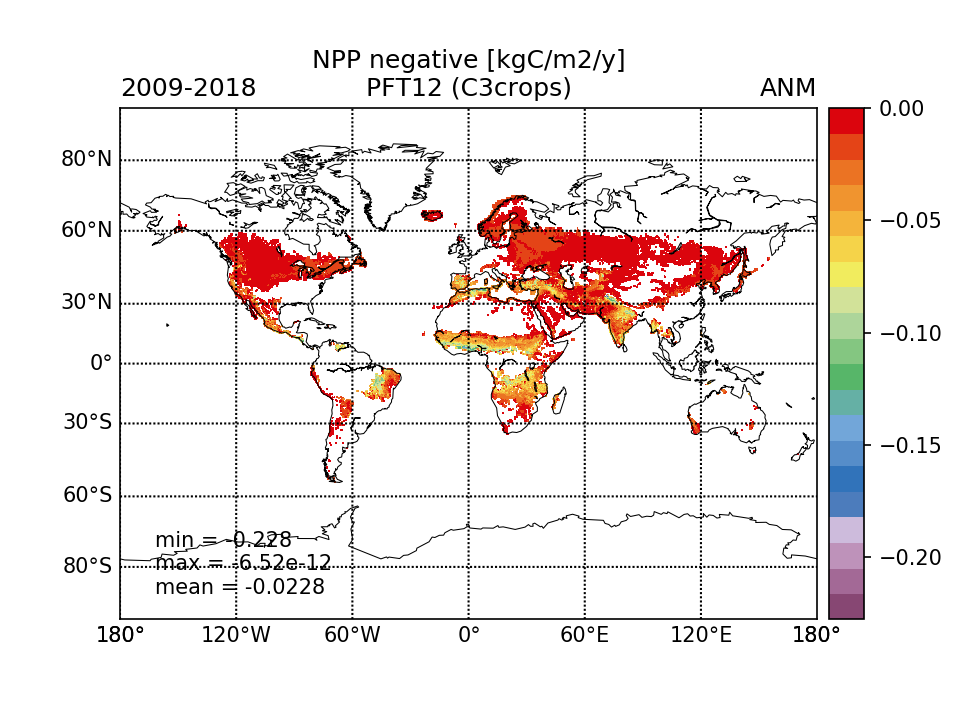
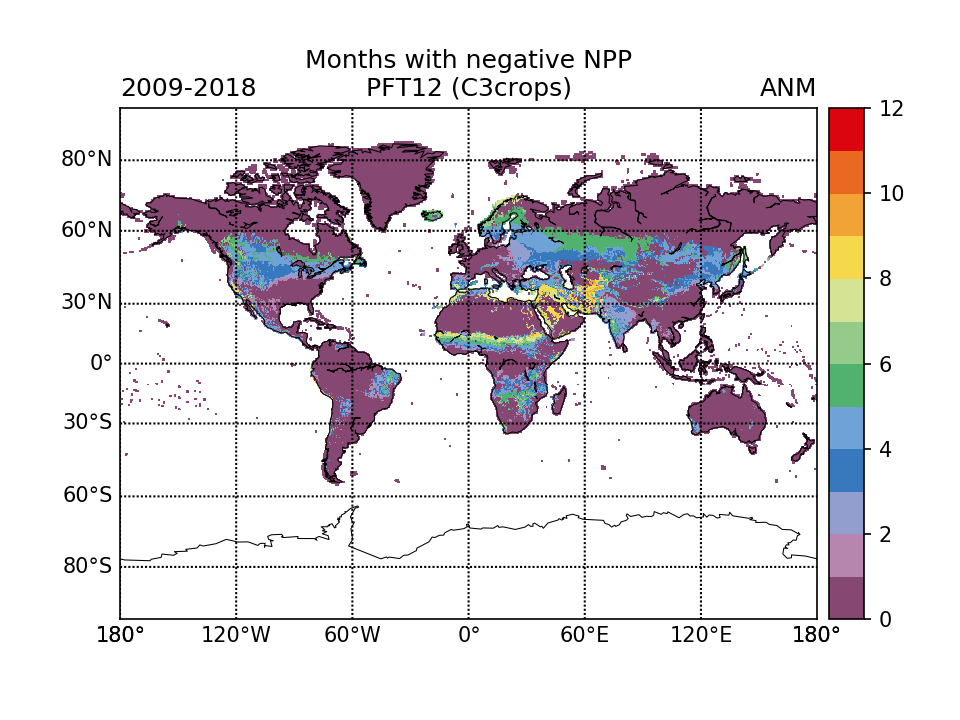
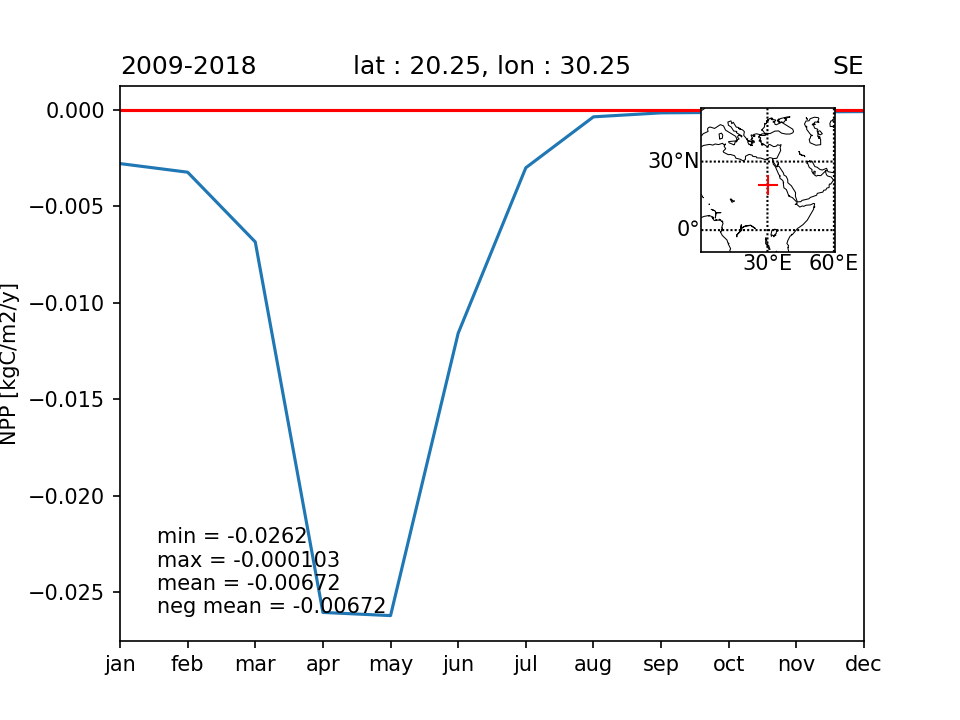
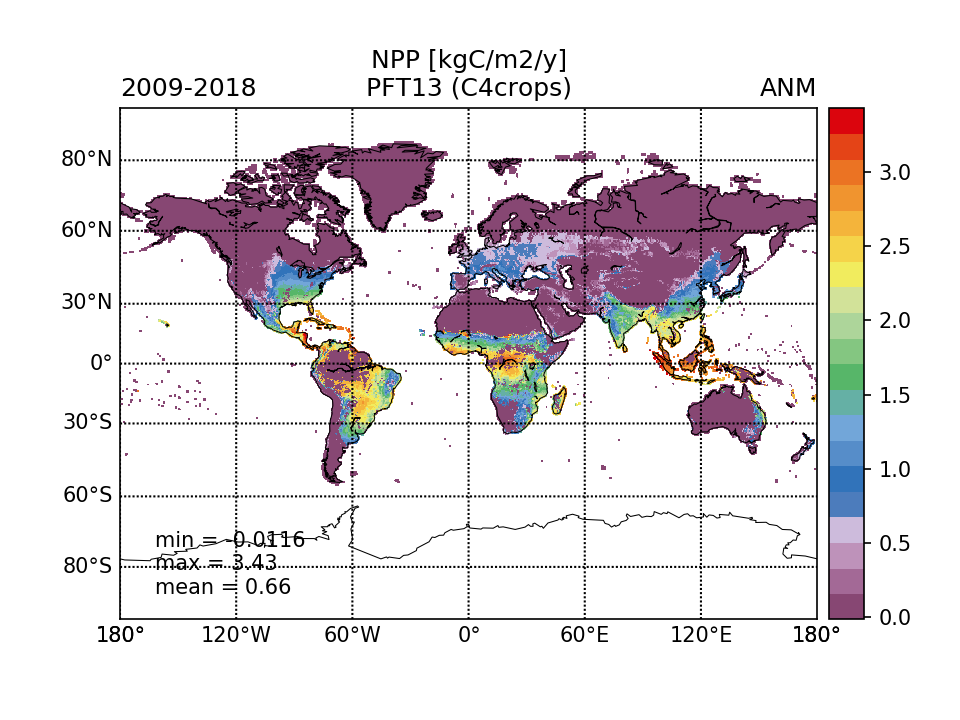
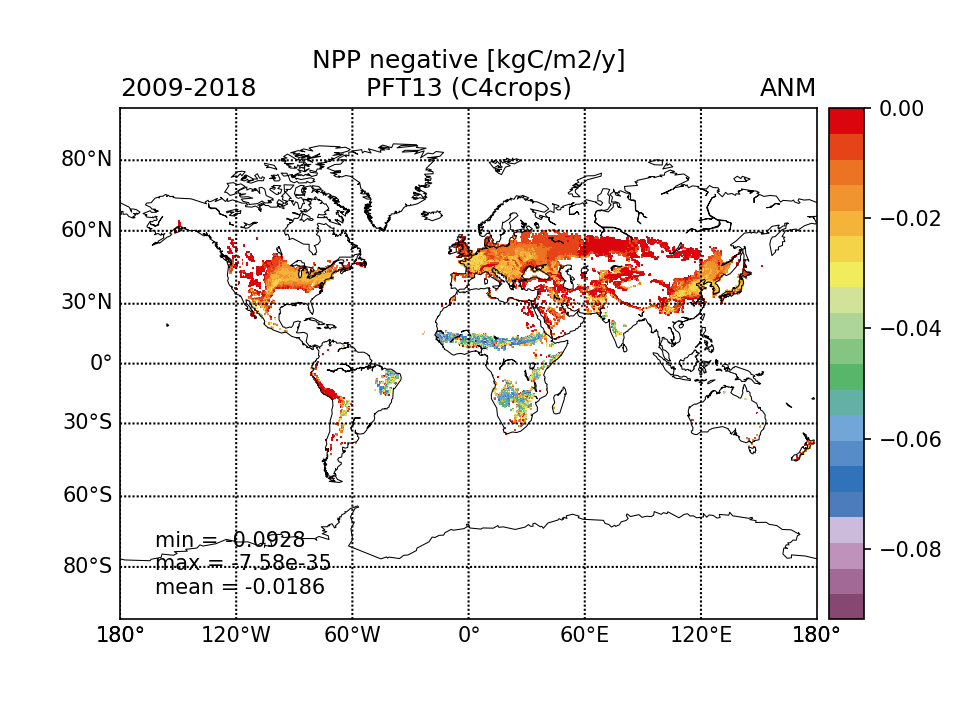
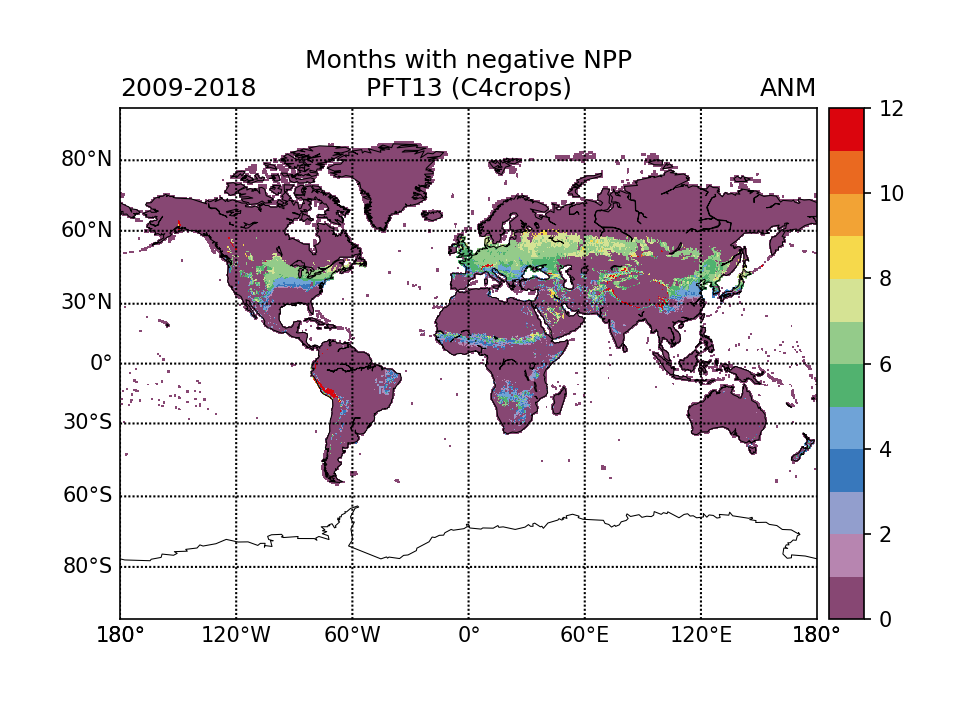
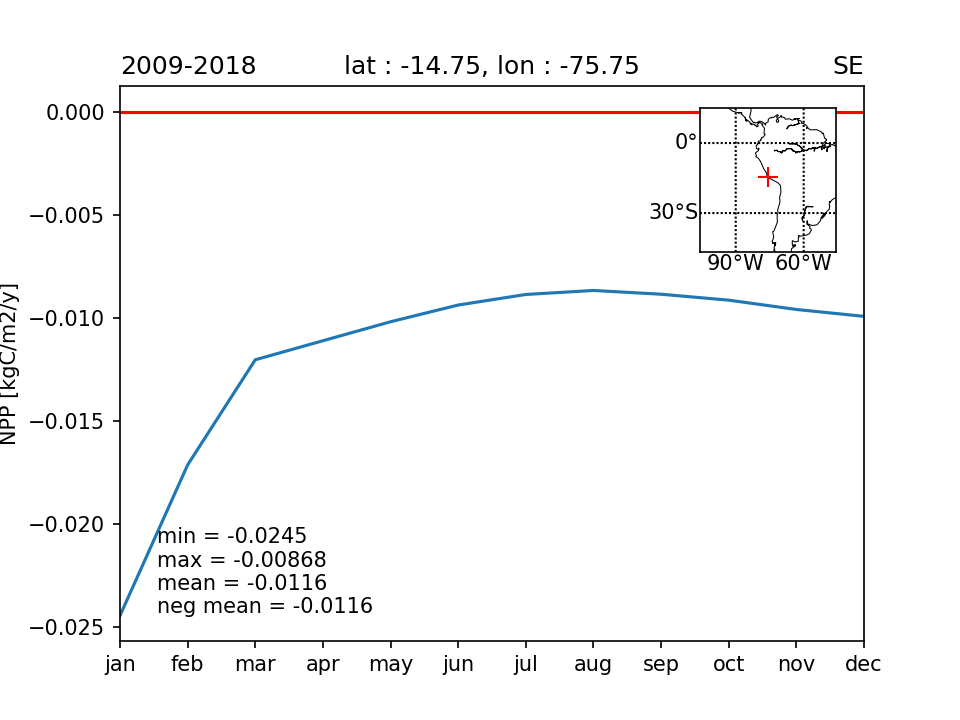
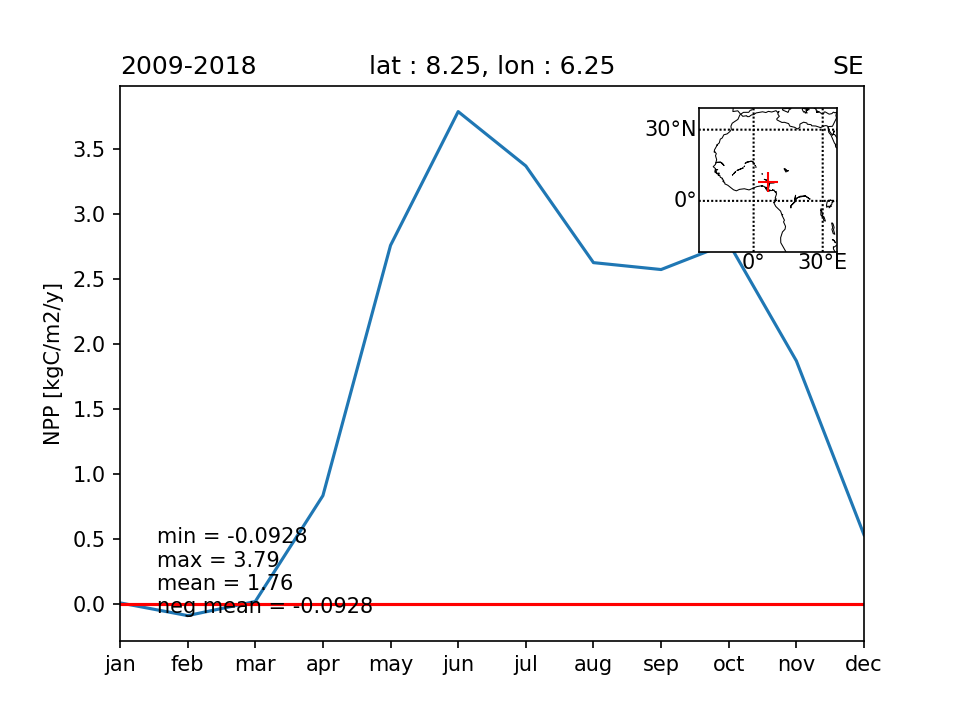
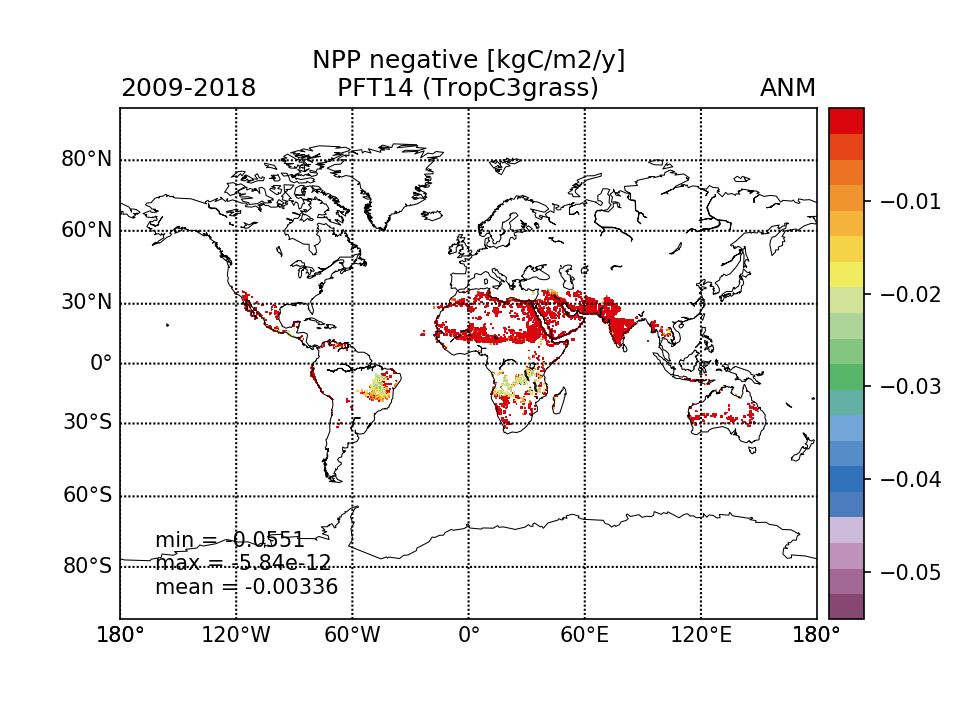
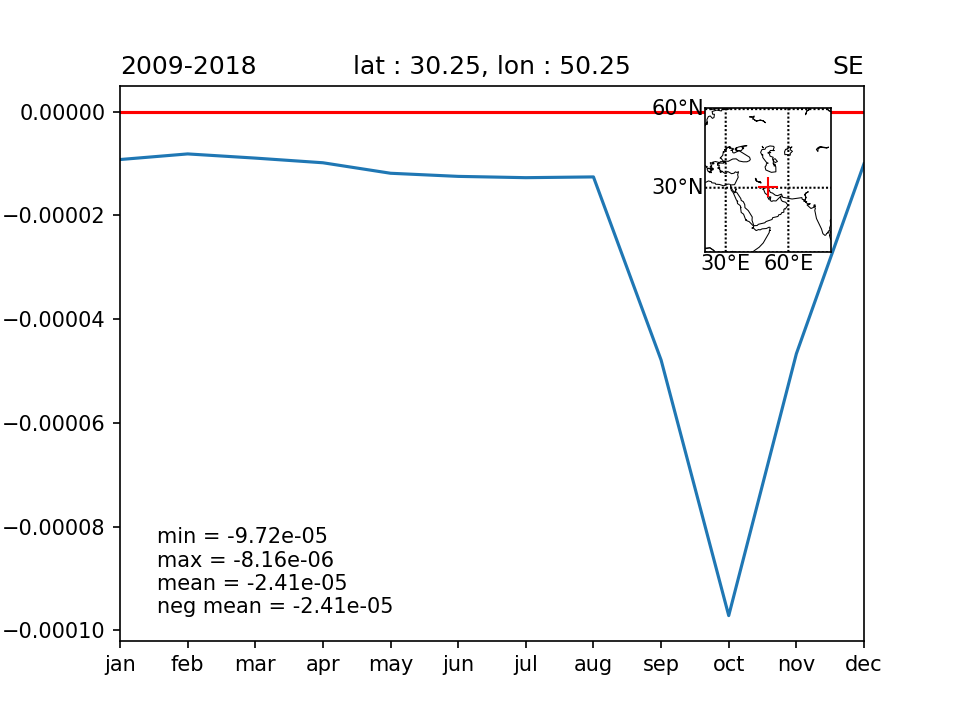
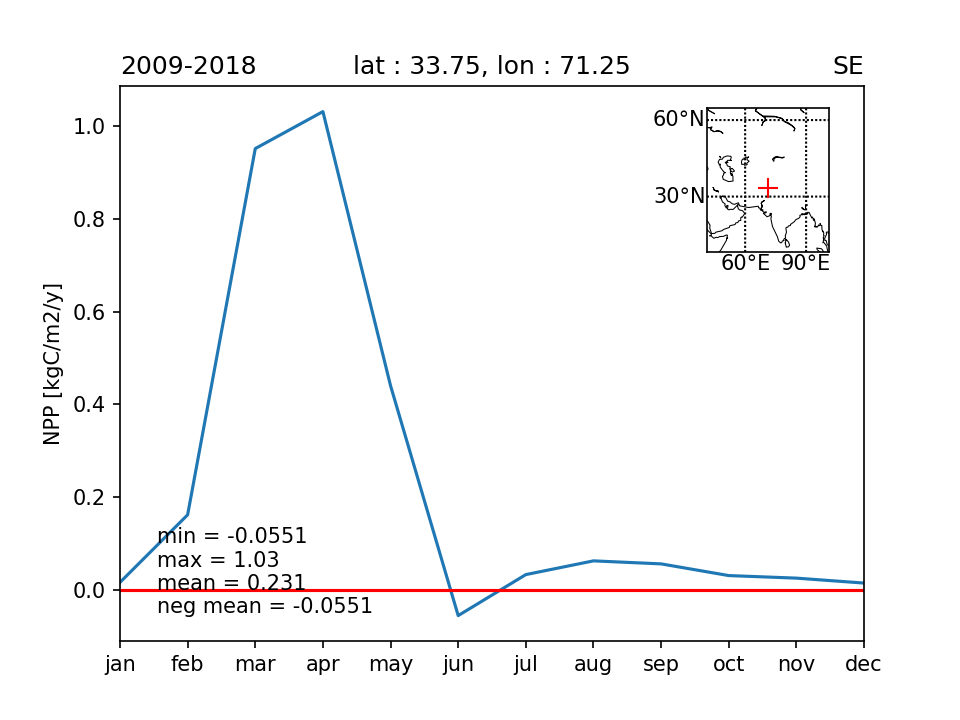
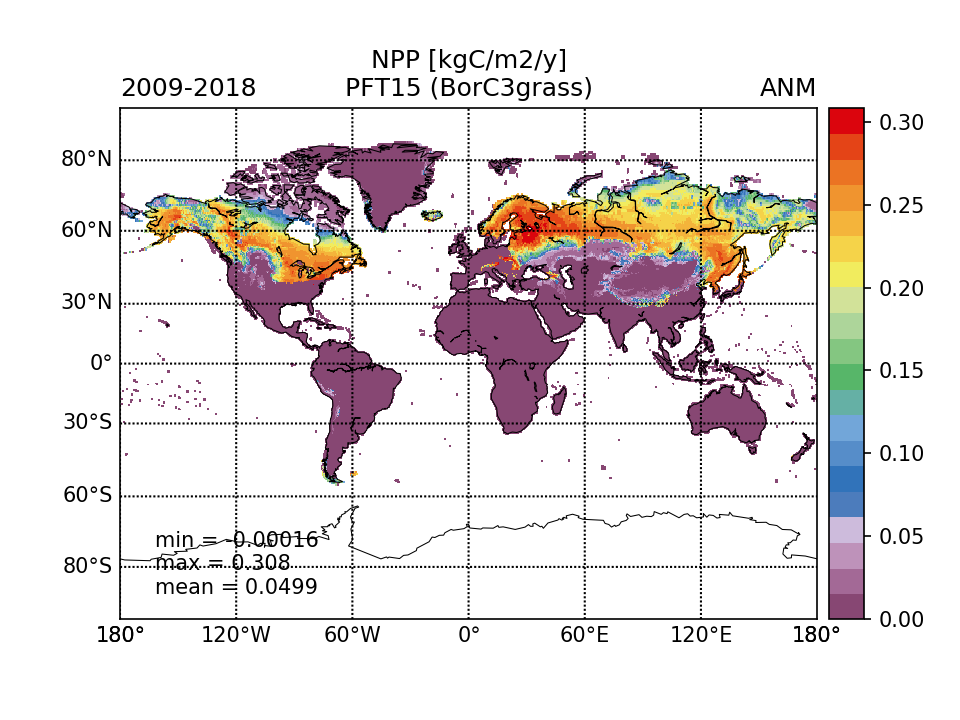
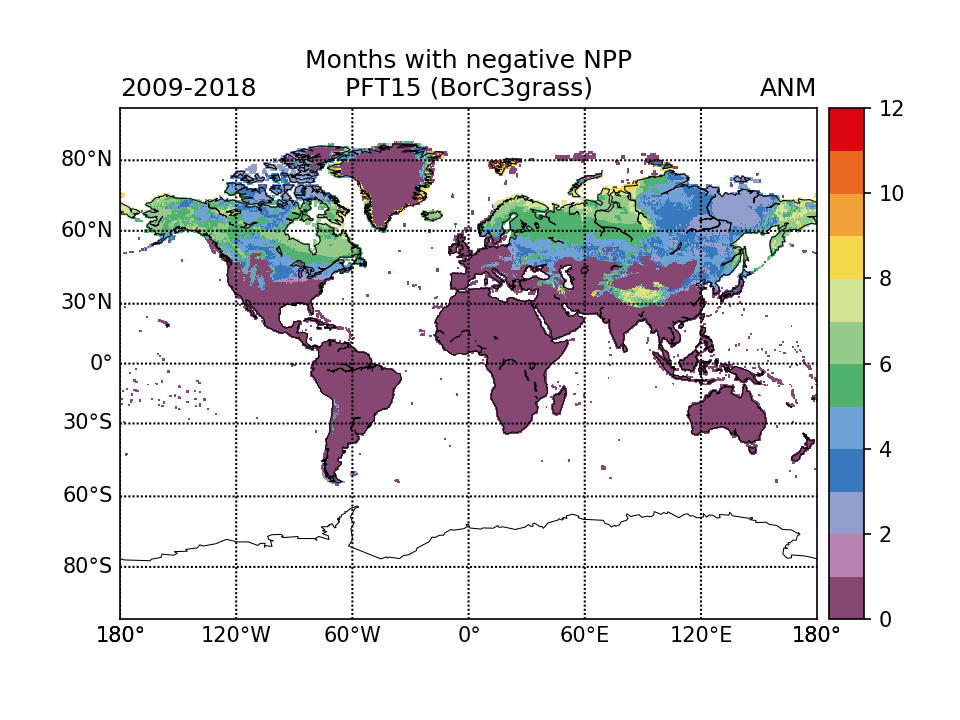
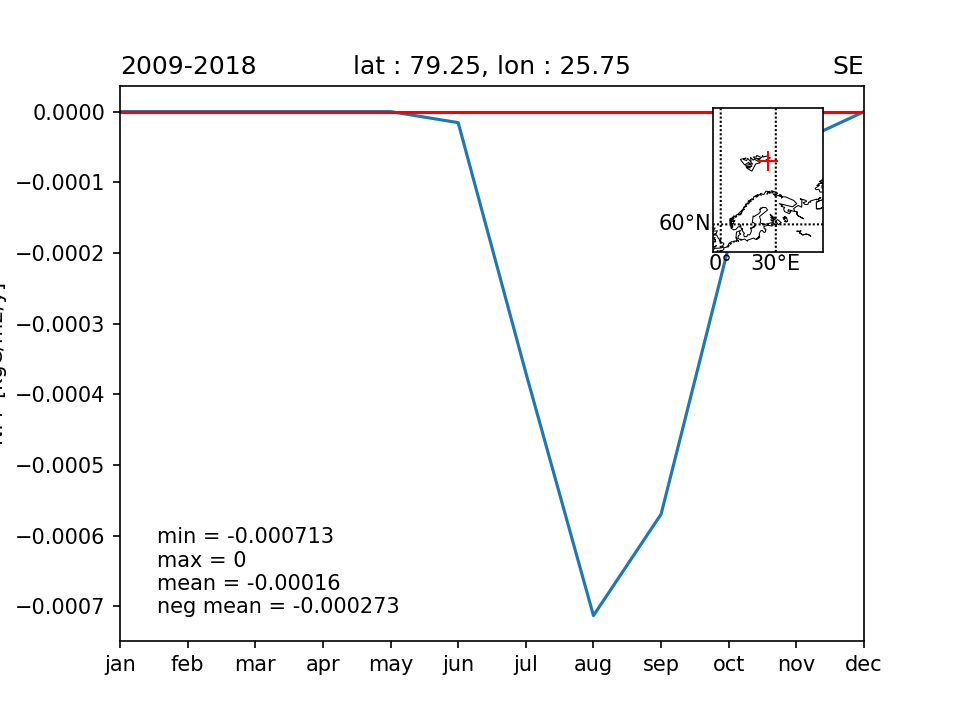
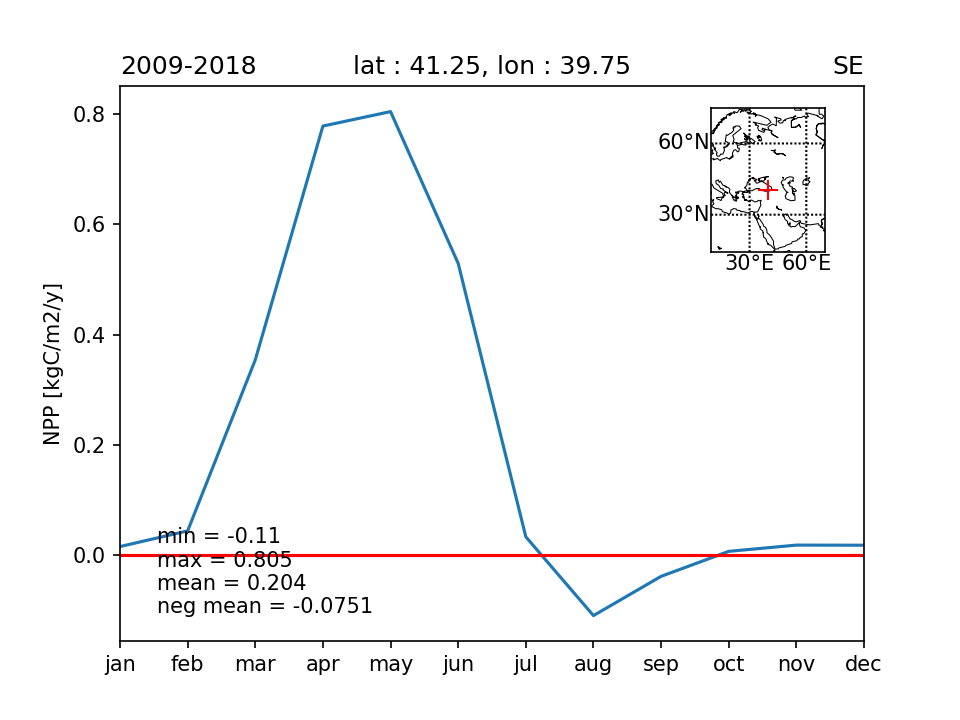
NEGATIVE NPP (STOMATE OUTPUTS)
The plots are produced for the standard TRENDY S3 simulation 2019 (0.5° resolution, monthly outputs, average for 2009-2018).
The data shown in columns:
 |  |  |  |  |
 |  |  |  |  |
 |  |  |  |  |
 |  |  |  |  |
 |  |  |  |  |
 |  |  |  |  |
 |  |  |  |  |
 |  |  |  |  |
 |  |  |  |  |
 |  |  |  |  |
 |  |  |  |  |
 |  |  |  |  |
 |  |  |  |  |
 |  |  |  |  |
| Last modified: 17/12/2019 08:34:43 |
| ← cSoil Drop | Negative NPP → |