3-STEP ALBEDO OPTIMIZATION
ORCHIDEE simulation configuration :
- Model : ORCHIDEE 2.2
- Forcing : CRUJRA v2 (0.5°)
- PFT maps : ESA CCI LC (1992-2018) aggregated to 0.25° with the old CWT "ESA -> Generic" and the new CWT "Generic -> ORCHIDEE"
- Period : 1992-2018 (with 10Y-spinup using fixed PFT map for 1992)
- Used in optimization : 12 monthly maps averaged for 2009-2018
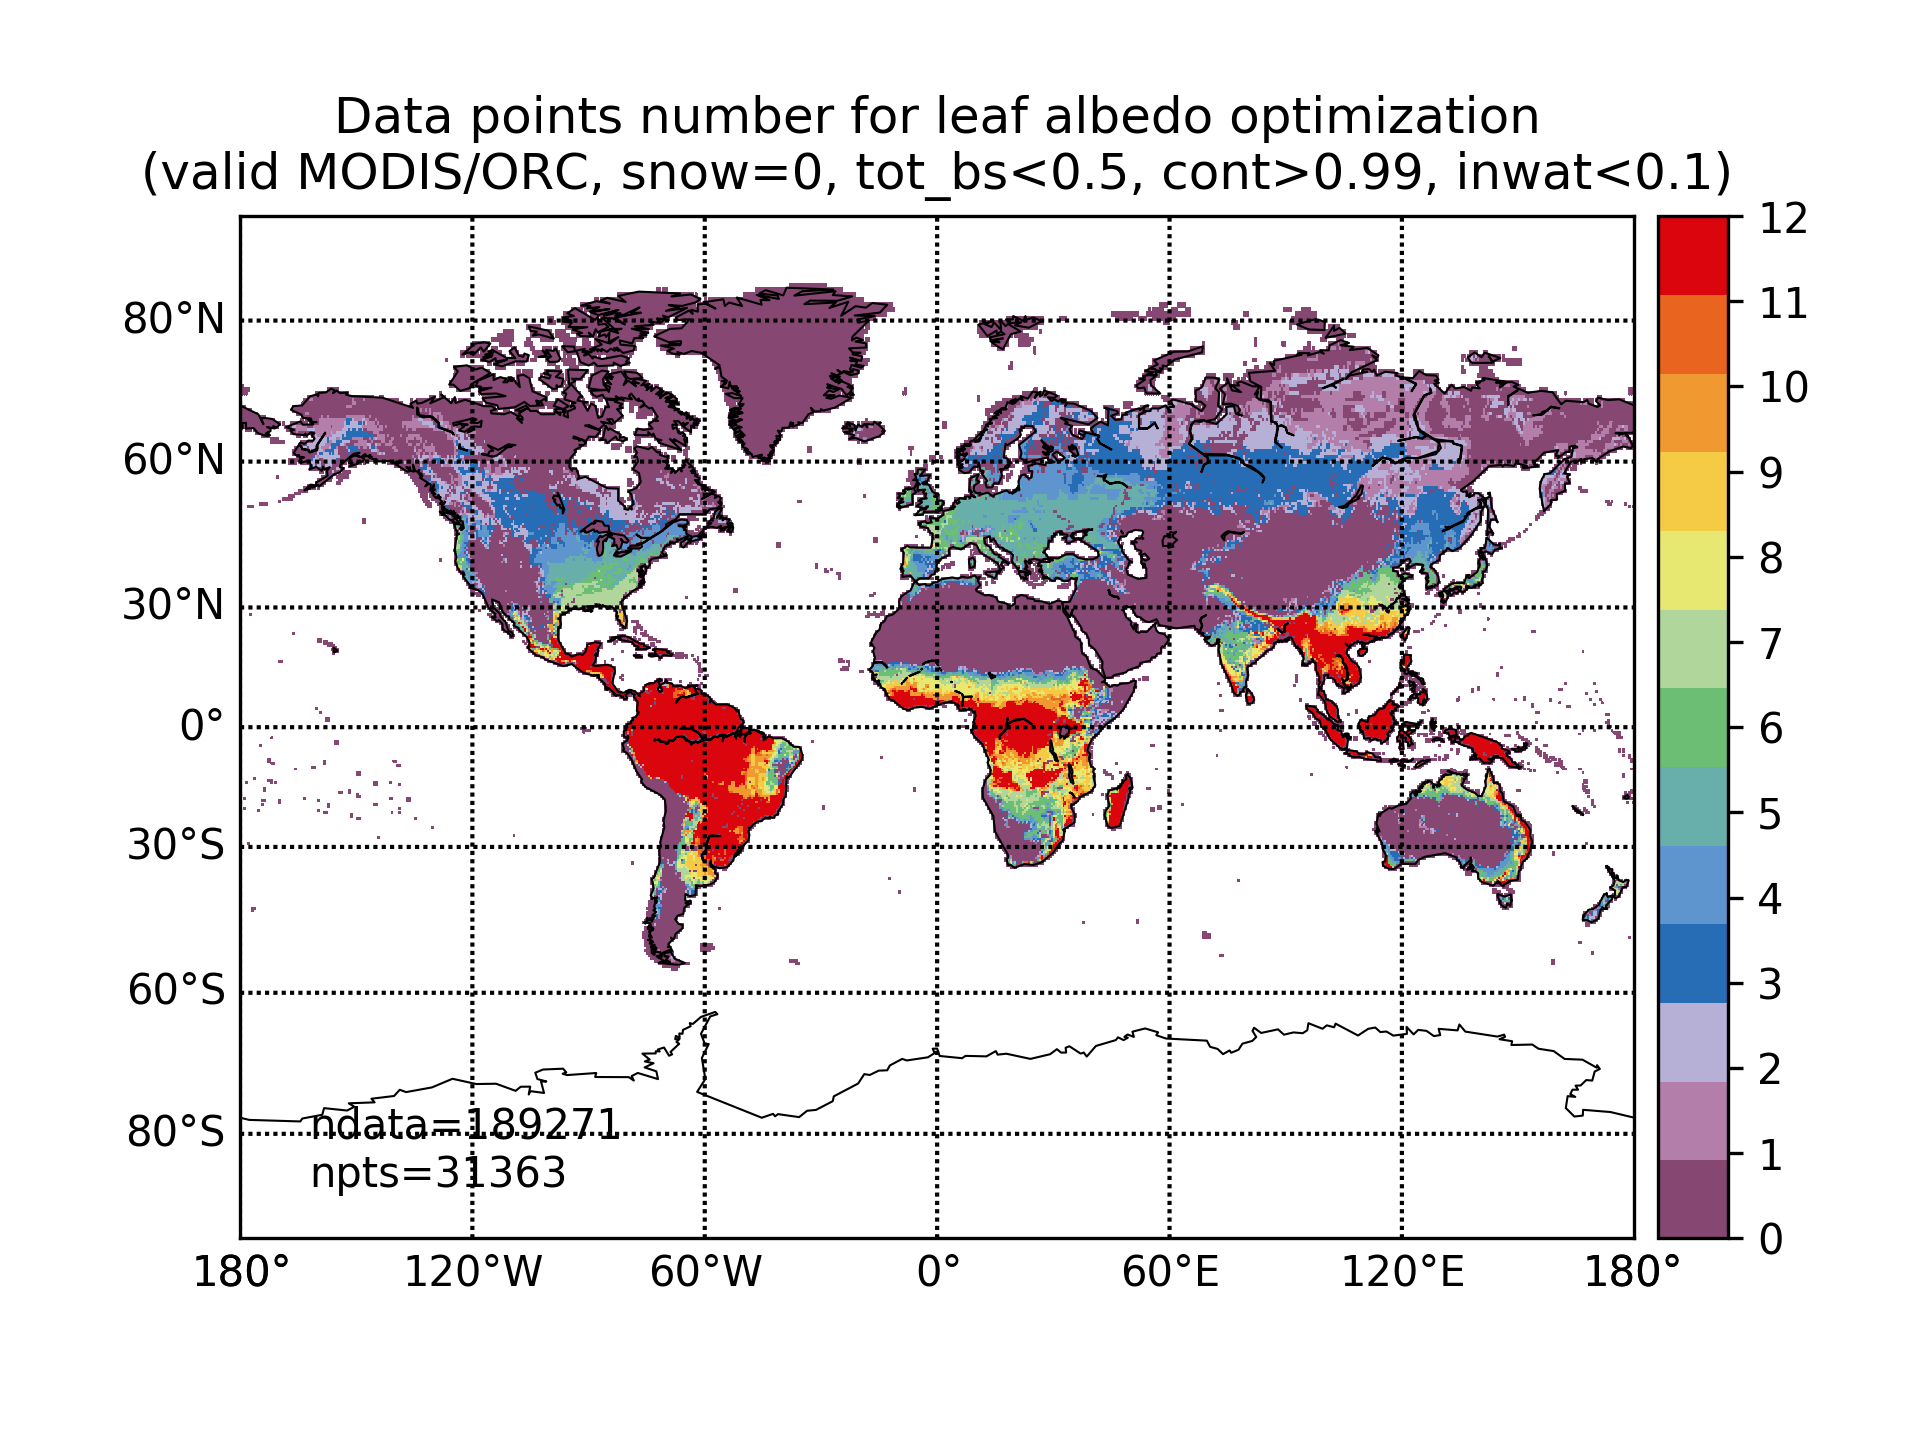
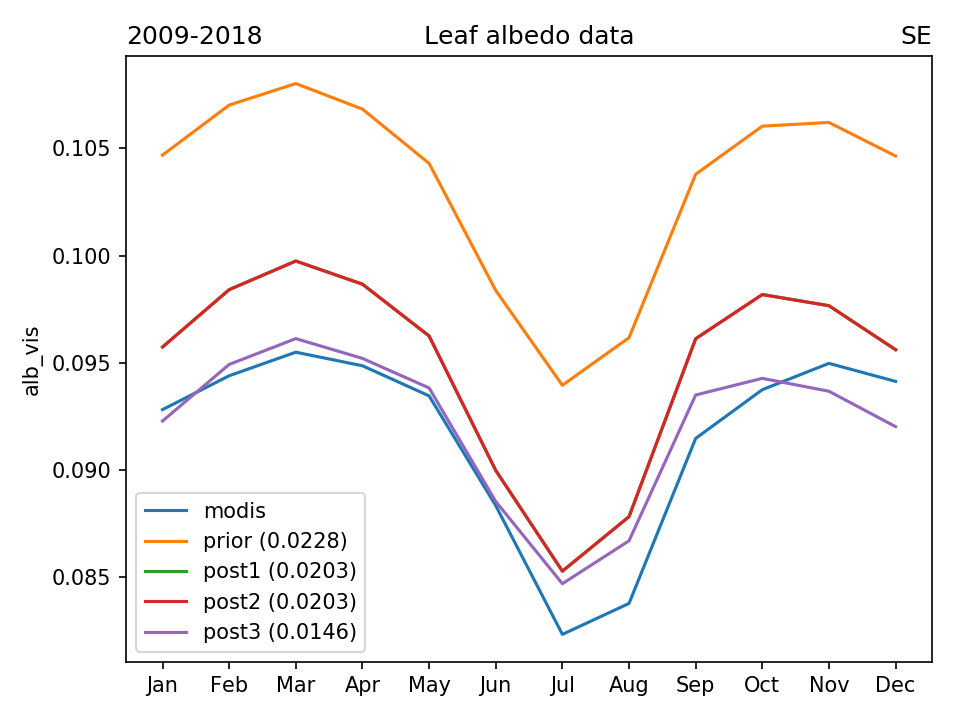
STEP 1 : LEAF ALBEDO OPTIMIZATION
Data points (month-pixels) selection :
- MODIS is valid (not masked)
- ORCHIDEE is valid (not masked)
- Snow fraction = 0
- Total bare soil fraction < 0.5
- Continental fraction > 0.99
- Inland water fraction < 0.1
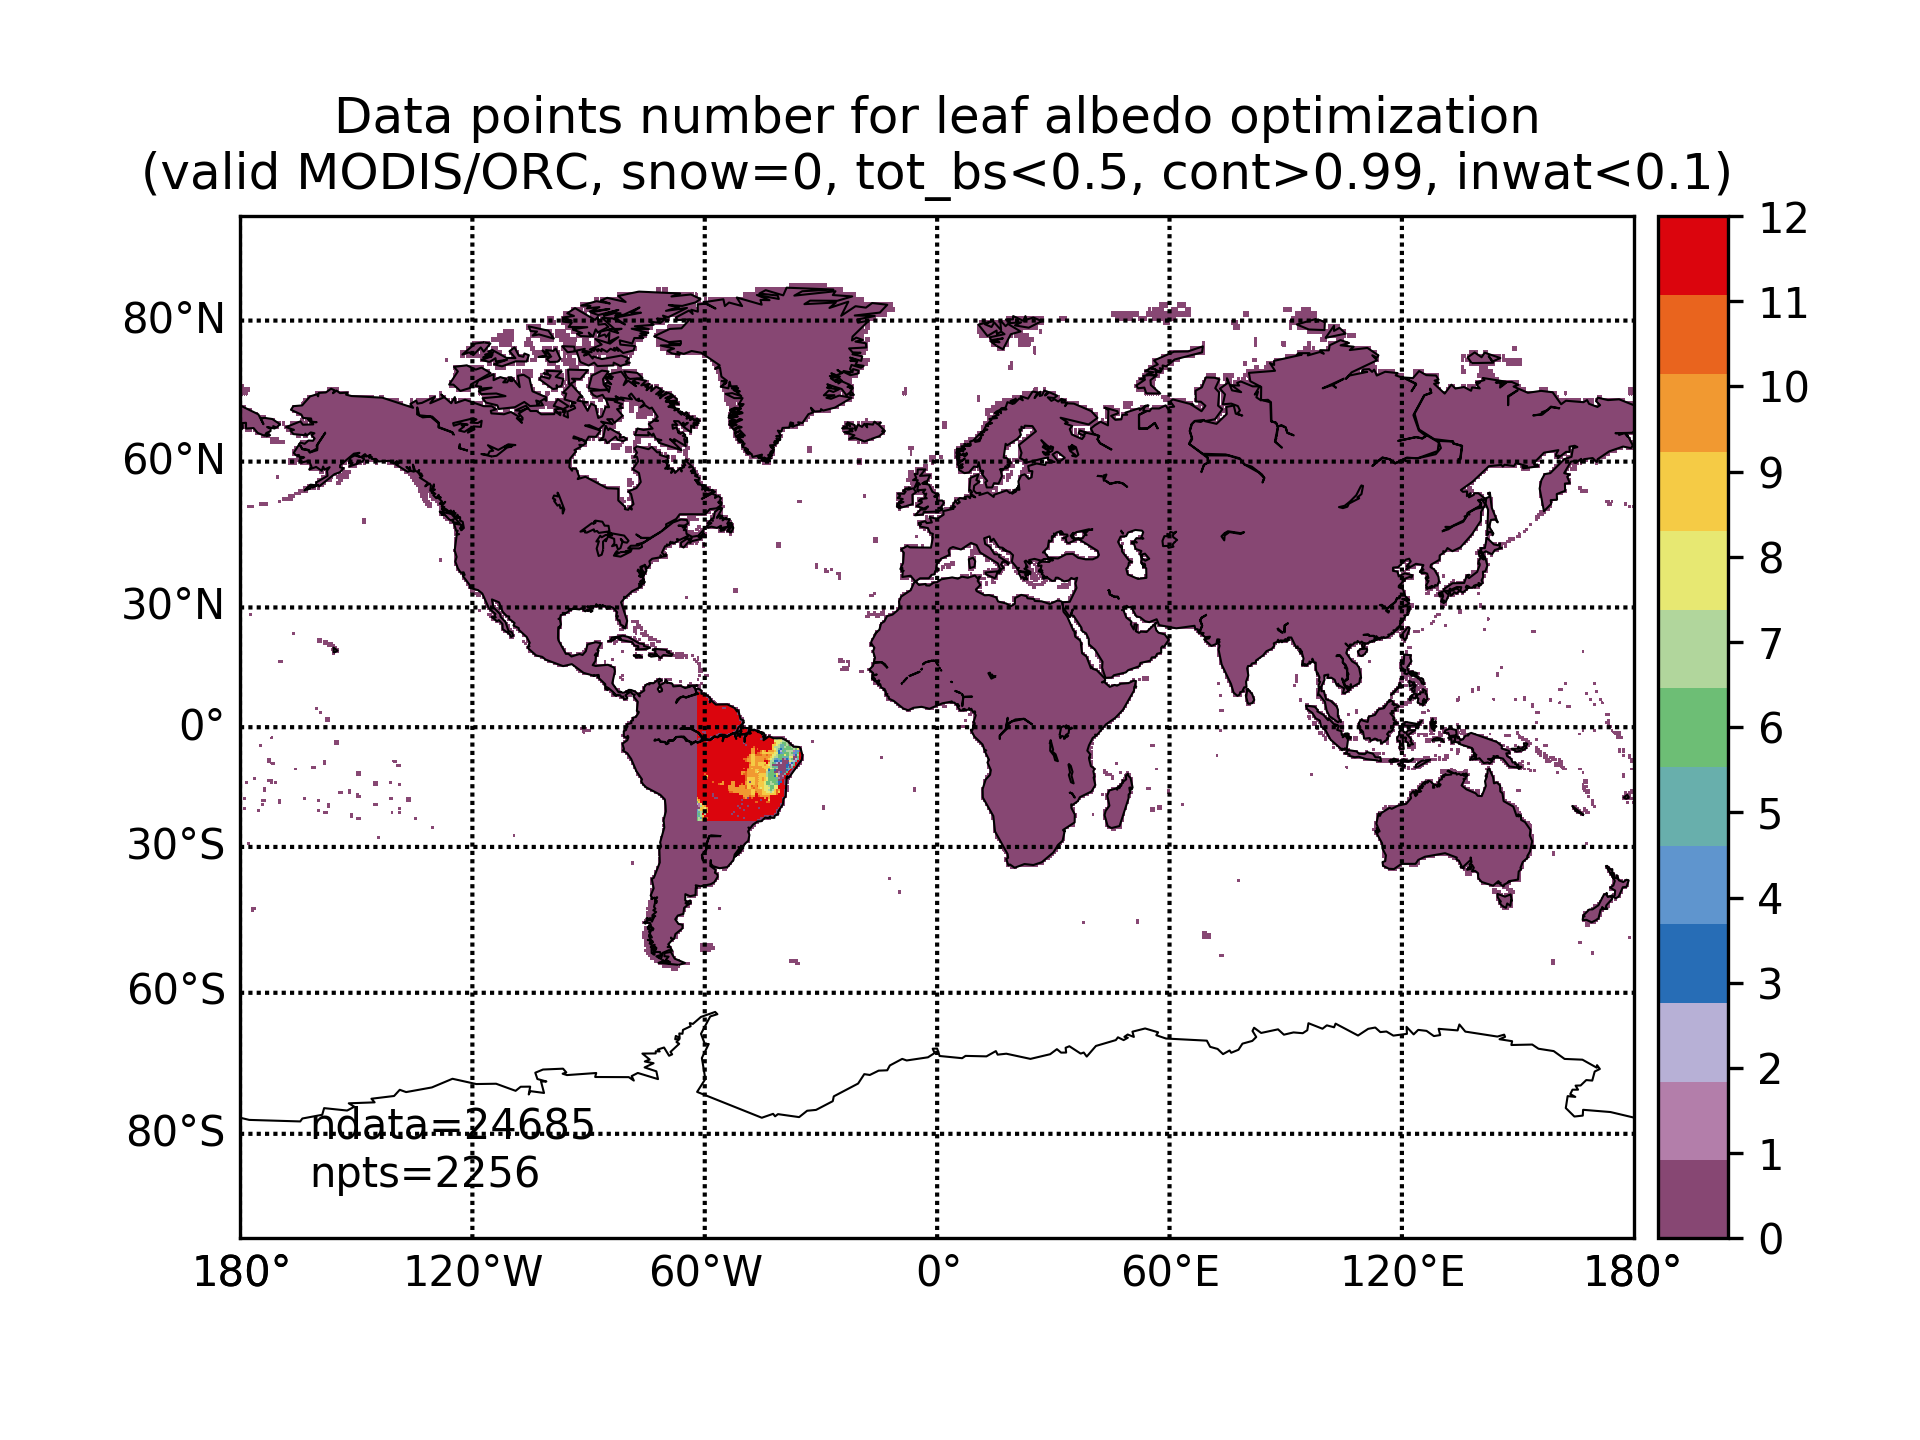
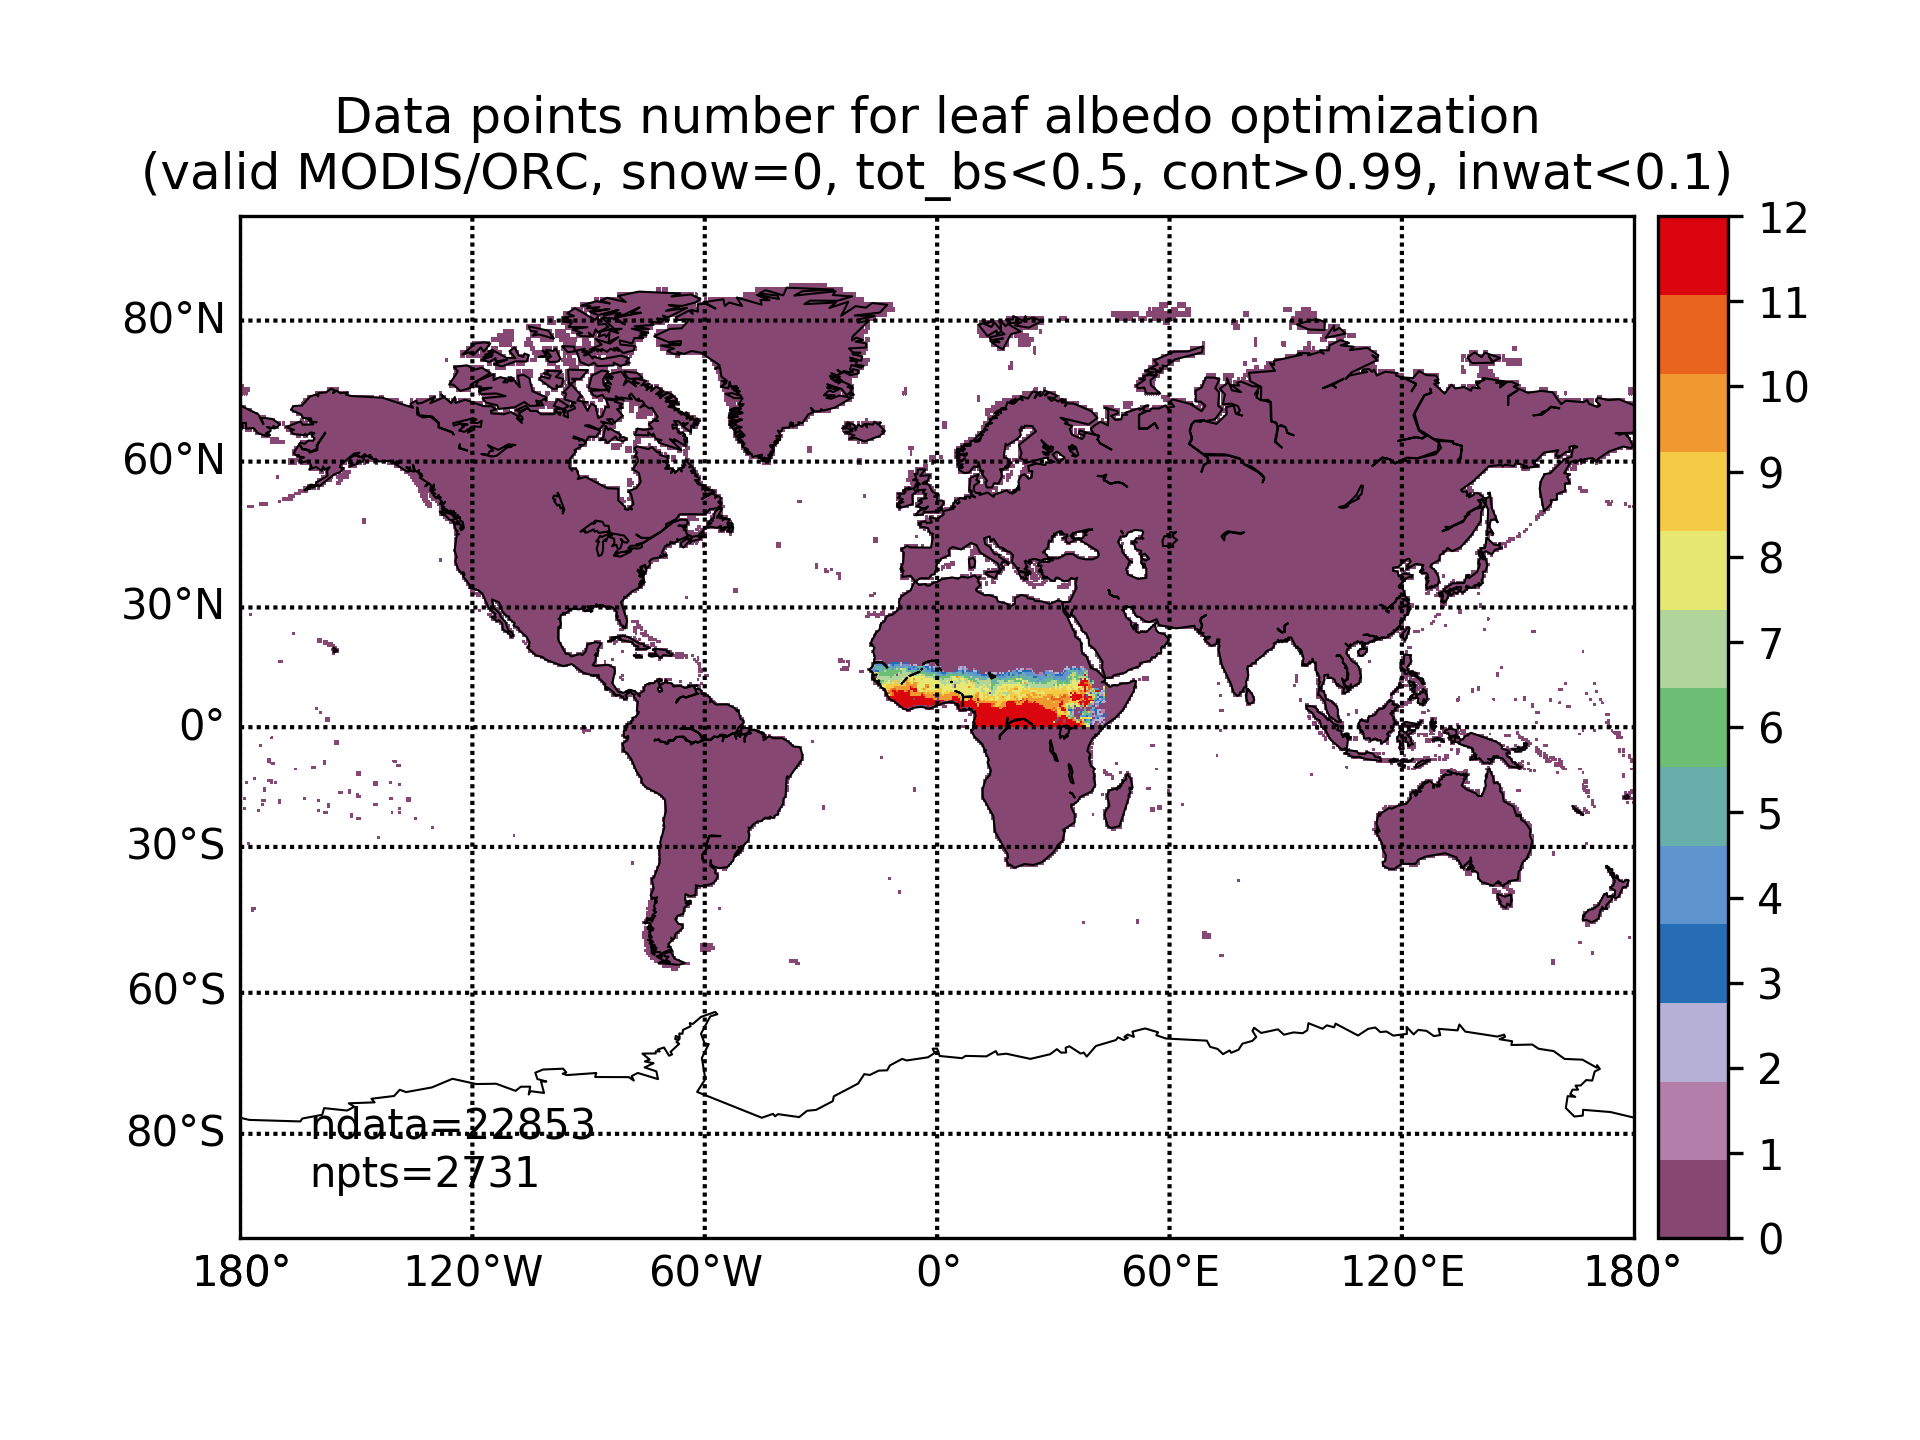
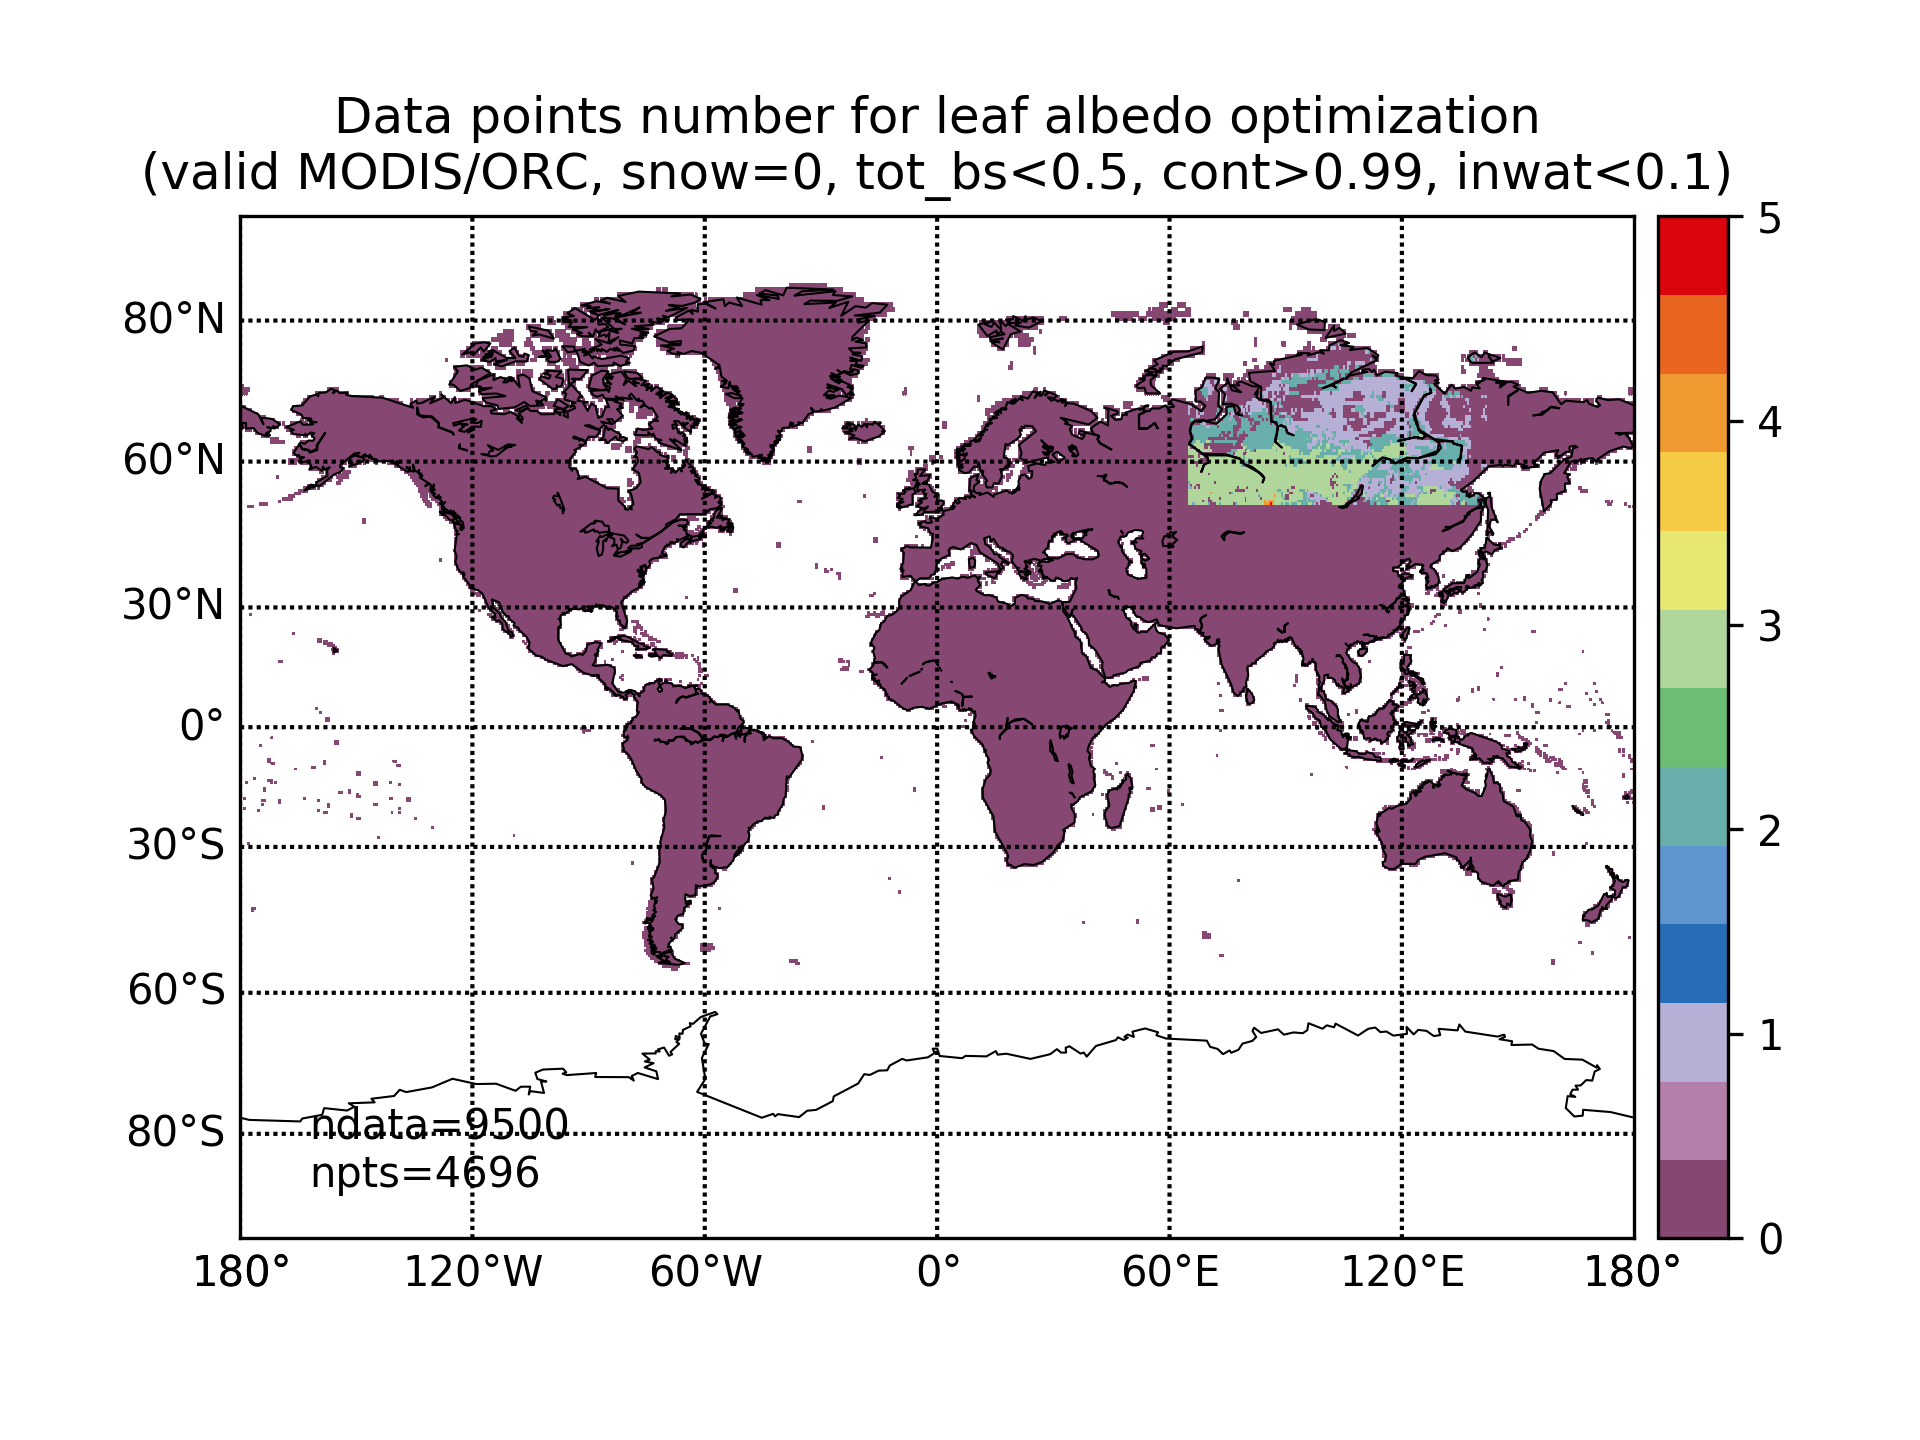
The graph below shows the number of data points (months) selected at each grid cell (from 0 to 12) :
Optimization method : L-BFGS-B with 14 optimized parameters, gradient calculation using analytical derivative
First test : wide ranges of variation, global data
| LEAF_ALB_NIR | PFT2 | PFT3 | PFT4 | PFT5 | PFT6 | PFT7 | PFT8 | PFT9 | PFT10 | PFT11 | PFT12 | PFT13 | PFT14 | PFT15 |
| prior | 0.23 | 0.18 | 0.18 | 0.2 | 0.24 | 0.15 | 0.26 | 0.2 | 0.24 | 0.27 | 0.28 | 0.26 | 0.24 | 0.24 |
| min | 0.1 | 0.1 | 0.1 | 0.1 | 0.1 | 0.1 | 0.1 | 0.1 | 0.1 | 0.1 | 0.1 | 0.1 | 0.1 | 0.1 |
| max | 0.3 | 0.3 | 0.3 | 0.3 | 0.3 | 0.3 | 0.3 | 0.3 | 0.4 | 0.4 | 0.4 | 0.4 | 0.4 | 0.4 |
| post | 0.205 | 0.186 | 0.15 | 0.176 | 0.235 | 0.129 | 0.271 | 0.186 | 0.29 | 0.261 | 0.259 | 0.289 | 0.232 | 0.311 |
| LEAF_ALB_VIS | PFT2 | PFT3 | PFT4 | PFT5 | PFT6 | PFT7 | PFT8 | PFT9 | PFT10 | PFT11 | PFT12 | PFT13 | PFT14 | PFT15 |
| prior | 0.04 | 0.04 | 0.04 | 0.04 | 0.03 | 0.03 | 0.03 | 0.03 | 0.06 | 0.06 | 0.06 | 0.06 | 0.06 | 0.06 |
| min | 0.01 | 0.01 | 0.01 | 0.01 | 0.01 | 0.01 | 0.01 | 0.01 | 0.01 | 0.01 | 0.01 | 0.01 | 0.01 | 0.01 |
| max | 0.05 | 0.05 | 0.05 | 0.05 | 0.05 | 0.05 | 0.05 | 0.05 | 0.1 | 0.1 | 0.1 | 0.1 | 0.1 | 0.1 |
| post | 0.0222 | 0.0296 | 0.0296 | 0.0234 | 0.0152 | 0.0304 | 0.0297 | 0.01 | 0.0465 | 0.0313 | 0.0524 | 0.0608 | 0.01 | 0.0217 |
Second test : tuned ranges of variation, global data
| LEAF_ALB_NIR | PFT2 | PFT3 | PFT4 | PFT5 | PFT6 | PFT7 | PFT8 | PFT9 | PFT10 | PFT11 | PFT12 | PFT13 | PFT14 | PFT15 |
| prior | 0.23 | 0.18 | 0.18 | 0.2 | 0.24 | 0.15 | 0.26 | 0.2 | 0.24 | 0.27 | 0.28 | 0.26 | 0.24 | 0.24 |
| min | 0.17 | 0.17 | 0.1 | 0.1 | 0.16 | 0.1 | 0.1 | 0.16 | 0.1 | 0.17 | 0.1 | 0.15 | 0.1 | 0.2 |
| max | 0.25 | 0.24 | 0.23 | 0.24 | 0.24 | 0.19 | 0.33 | 0.23 | 0.36 | 0.36 | 0.46 | 0.36 | 0.29 | 0.35 |
| post | 0.204 | 0.189 | 0.15 | 0.176 | 0.228 | 0.129 | 0.263 | 0.178 | 0.296 | 0.258 | 0.259 | 0.292 | 0.222 | 0.323 |
| LEAF_ALB_VIS | PFT2 | PFT3 | PFT4 | PFT5 | PFT6 | PFT7 | PFT8 | PFT9 | PFT10 | PFT11 | PFT12 | PFT13 | PFT14 | PFT15 |
| prior | 0.04 | 0.04 | 0.04 | 0.04 | 0.03 | 0.03 | 0.03 | 0.03 | 0.06 | 0.06 | 0.06 | 0.06 | 0.06 | 0.06 |
| min | 0.02 | 0.02 | 0.01 | 0.01 | 0.02 | 0.01 | 0.02 | 0.02 | 0.02 | 0.04 | 0.02 | 0.05 | 0.02 | 0.04 |
| max | 0.06 | 0.08 | 0.09 | 0.08 | 0.07 | 0.05 | 0.04 | 0.04 | 0.18 | 0.18 | 0.23 | 0.15 | 0.16 | 0.1 |
| post | 0.0225 | 0.02 | 0.0231 | 0.0231 | 0.02 | 0.0234 | 0.02 | 0.02 | 0.0464 | 0.0485 | 0.0513 | 0.0606 | 0.02 | 0.04 |
AMAZON
| LEAF_ALB_NIR | PFT2 | PFT3 | PFT4 | PFT5 | PFT6 | PFT7 | PFT8 | PFT9 | PFT10 | PFT11 | PFT12 | PFT13 | PFT14 | PFT15 |
| prior | 0.23 | 0.18 | 0.18 | 0.2 | 0.24 | 0.15 | 0.26 | 0.2 | 0.24 | 0.27 | 0.28 | 0.26 | 0.24 | 0.24 |
| min | 0.17 | 0.17 | 0.1 | 0.1 | 0.16 | 0.1 | 0.1 | 0.16 | 0.13 | 0.18 | 0.1 | 0.24 | 0.1 | 0.2 |
| max | 0.24 | 0.24 | 0.23 | 0.22 | 0.21 | 0.19 | 0.33 | 0.23 | 0.27 | 0.27 | 0.46 | 0.3 | 0.26 | 0.27 |
| post | 0.211 | 0.185 | 0.15 | 0.22 | 0.21 | 0.129 | 0.263 | 0.178 | 0.261 | 0.27 | 0.259 | 0.264 | 0.26 | 0.24 |
| LEAF_ALB_VIS | PFT2 | PFT3 | PFT4 | PFT5 | PFT6 | PFT7 | PFT8 | PFT9 | PFT10 | PFT11 | PFT12 | PFT13 | PFT14 | PFT15 |
| prior | 0.04 | 0.04 | 0.04 | 0.04 | 0.03 | 0.03 | 0.03 | 0.03 | 0.06 | 0.06 | 0.06 | 0.06 | 0.06 | 0.06 |
| min | 0.02 | 0.02 | 0.01 | 0.02 | 0.02 | 0.01 | 0.02 | 0.02 | 0.03 | 0.04 | 0.02 | 0.05 | 0.02 | 0.07 |
| max | 0.03 | 0.05 | 0.06 | 0.05 | 0.04 | 0.05 | 0.04 | 0.04 | 0.11 | 0.07 | 0.23 | 0.08 | 0.09 | 0.1 |
| post | 0.0226 | 0.0237 | 0.0231 | 0.0208 | 0.02 | 0.0234 | 0.02 | 0.02 | 0.0454 | 0.04 | 0.0513 | 0.05 | 0.02 | 0.07 |
SAHEL
| LEAF_ALB_NIR | PFT2 | PFT3 | PFT4 | PFT5 | PFT6 | PFT7 | PFT8 | PFT9 | PFT10 | PFT11 | PFT12 | PFT13 | PFT14 | PFT15 |
| prior | 0.23 | 0.18 | 0.18 | 0.2 | 0.24 | 0.15 | 0.26 | 0.2 | 0.24 | 0.27 | 0.28 | 0.26 | 0.24 | 0.24 |
| min | 0.17 | 0.19 | 0.12 | 0.13 | 0.16 | 0.1 | 0.1 | 0.16 | 0.1 | 0.18 | 0.11 | 0.19 | 0.1 | 0.2 |
| max | 0.23 | 0.24 | 0.23 | 0.24 | 0.24 | 0.19 | 0.33 | 0.23 | 0.36 | 0.27 | 0.46 | 0.36 | 0.29 | 0.35 |
| post | 0.18 | 0.19 | 0.12 | 0.201 | 0.16 | 0.129 | 0.263 | 0.178 | 0.296 | 0.27 | 0.235 | 0.317 | 0.222 | 0.323 |
| LEAF_ALB_VIS | PFT2 | PFT3 | PFT4 | PFT5 | PFT6 | PFT7 | PFT8 | PFT9 | PFT10 | PFT11 | PFT12 | PFT13 | PFT14 | PFT15 |
| prior | 0.04 | 0.04 | 0.04 | 0.04 | 0.03 | 0.03 | 0.03 | 0.03 | 0.06 | 0.06 | 0.06 | 0.06 | 0.06 | 0.06 |
| min | 0.02 | 0.03 | 0.02 | 0.02 | 0.02 | 0.01 | 0.02 | 0.02 | 0.02 | 0.04 | 0.04 | 0.08 | 0.02 | 0.04 |
| max | 0.06 | 0.08 | 0.09 | 0.08 | 0.07 | 0.05 | 0.04 | 0.04 | 0.18 | 0.07 | 0.23 | 0.14 | 0.16 | 0.1 |
| post | 0.0231 | 0.03 | 0.09 | 0.02 | 0.02 | 0.0234 | 0.02 | 0.02 | 0.0464 | 0.0591 | 0.04 | 0.0993 | 0.02 | 0.04 |
SIBERIA
| LEAF_ALB_NIR | PFT2 | PFT3 | PFT4 | PFT5 | PFT6 | PFT7 | PFT8 | PFT9 | PFT10 | PFT11 | PFT12 | PFT13 | PFT14 | PFT15 |
| prior | 0.23 | 0.18 | 0.18 | 0.2 | 0.24 | 0.15 | 0.26 | 0.2 | 0.24 | 0.27 | 0.28 | 0.26 | 0.24 | 0.24 |
| min | 0.17 | 0.17 | 0.1 | 0.1 | 0.16 | 0.12 | 0.24 | 0.17 | 0.19 | 0.17 | 0.22 | 0.15 | 0.1 | 0.2 |
| max | 0.25 | 0.24 | 0.23 | 0.24 | 0.24 | 0.19 | 0.33 | 0.23 | 0.28 | 0.36 | 0.29 | 0.36 | 0.29 | 0.35 |
| post | 0.204 | 0.189 | 0.15 | 0.176 | 0.228 | 0.143 | 0.244 | 0.181 | 0.19 | 0.258 | 0.274 | 0.292 | 0.222 | 0.313 |
| LEAF_ALB_VIS | PFT2 | PFT3 | PFT4 | PFT5 | PFT6 | PFT7 | PFT8 | PFT9 | PFT10 | PFT11 | PFT12 | PFT13 | PFT14 | PFT15 |
| prior | 0.04 | 0.04 | 0.04 | 0.04 | 0.03 | 0.03 | 0.03 | 0.03 | 0.06 | 0.06 | 0.06 | 0.06 | 0.06 | 0.06 |
| min | 0.02 | 0.02 | 0.01 | 0.01 | 0.02 | 0.02 | 0.02 | 0.02 | 0.05 | 0.04 | 0.04 | 0.05 | 0.02 | 0.04 |
| max | 0.06 | 0.08 | 0.09 | 0.08 | 0.07 | 0.03 | 0.04 | 0.04 | 0.1 | 0.18 | 0.06 | 0.15 | 0.16 | 0.1 |
| post | 0.0225 | 0.02 | 0.0231 | 0.0231 | 0.02 | 0.02 | 0.02 | 0.02 | 0.0727 | 0.0485 | 0.04 | 0.0606 | 0.02 | 0.04 |
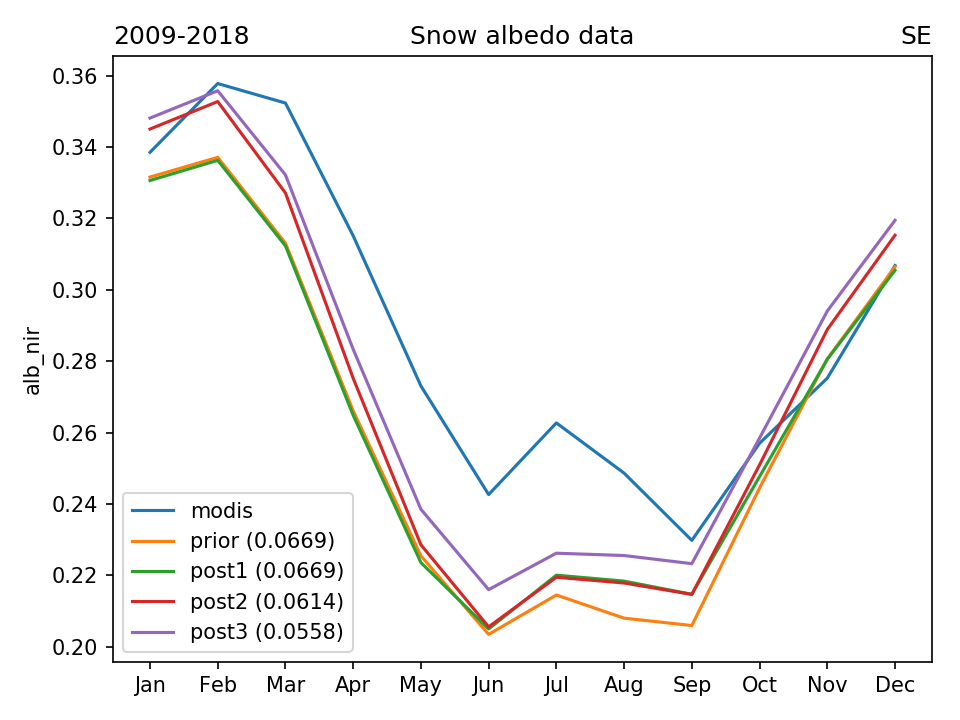
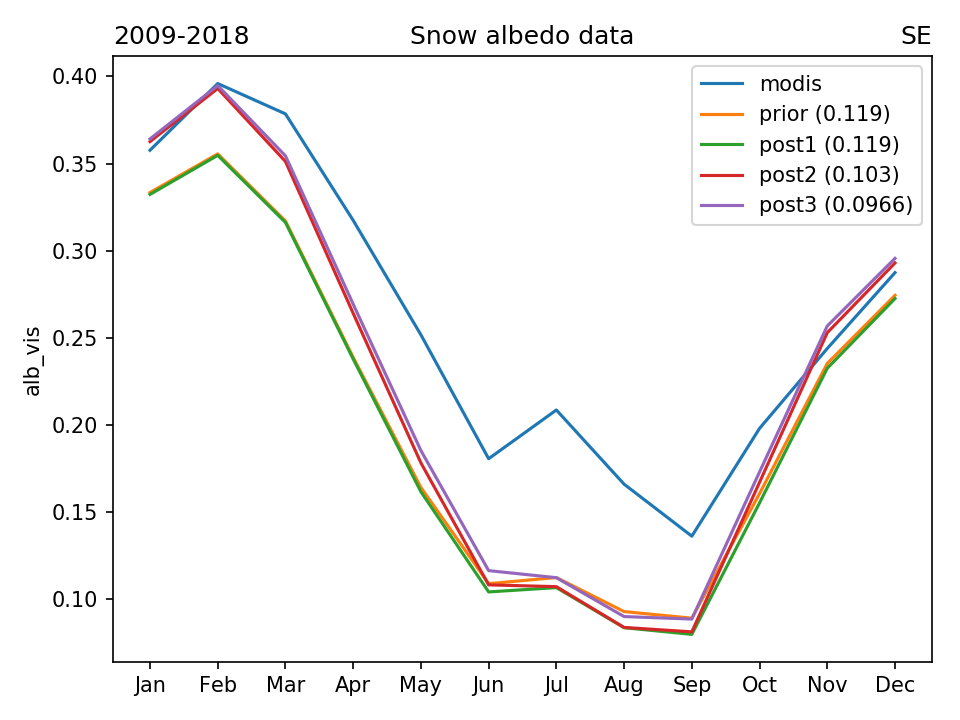
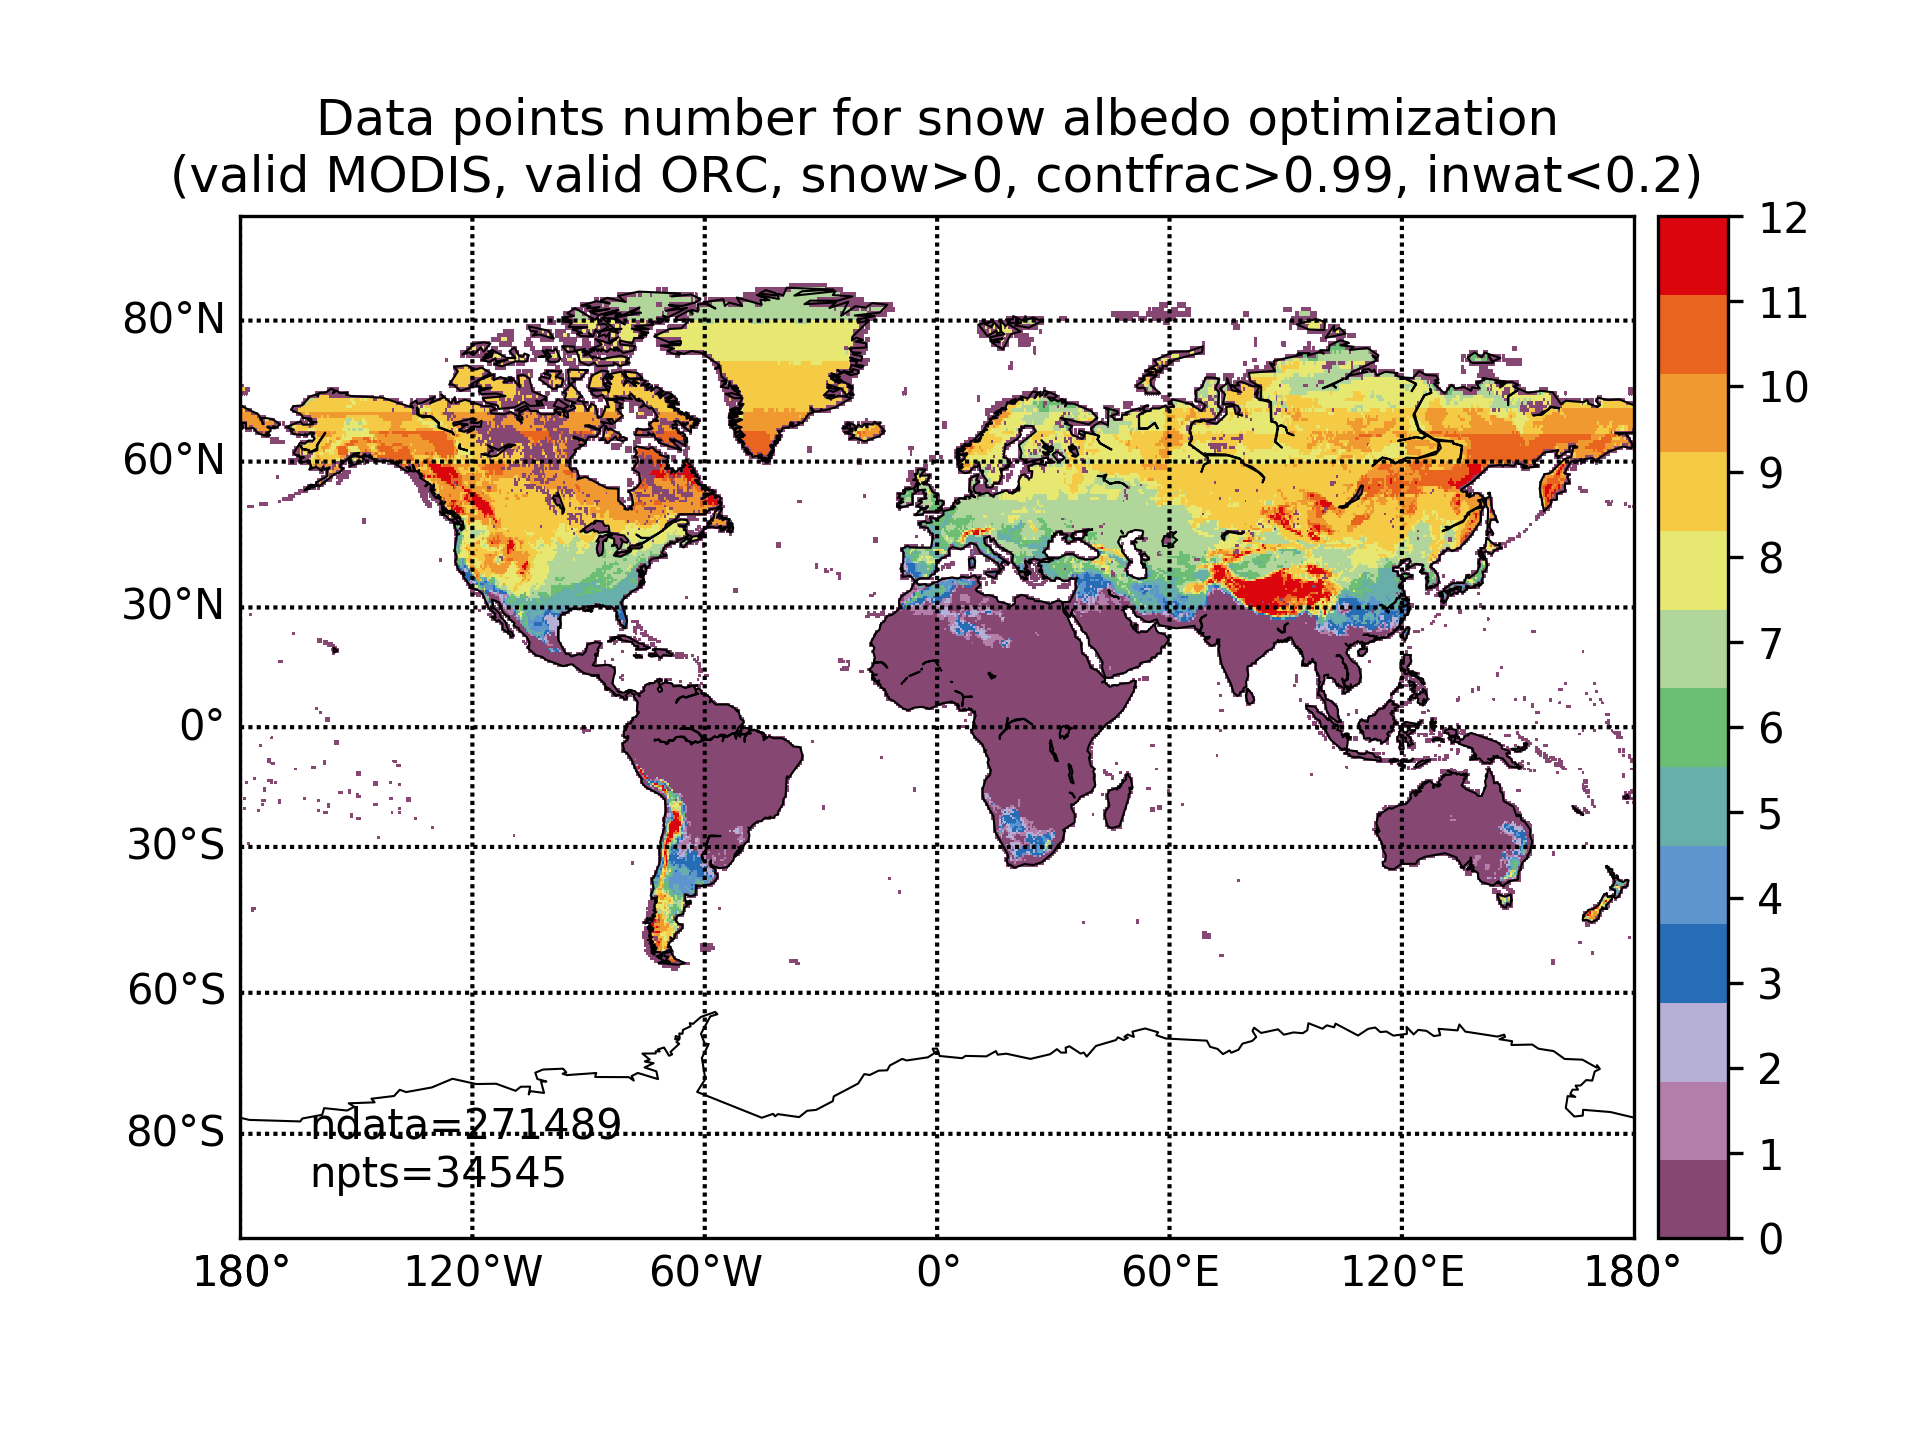
STEP 2 : SNOW ALBEDO OPTIMIZATION
Data points (month-pixels) selection :
- MODIS is valid (not masked)
- ORCHIDEE is valid (not masked)
- Snow fraction > 0
- Continental fraction > 0.99
- Inland water fraction < 0.2
The graph below shows the number of data points (months) selected at each grid cell (from 0 to 12) :
Optimization method : L-BFGS-B with 24 optimized parameters, gradient calculation using finite differences approach
| SNOW_ALB_NIR | PFT1 | PFT2 | PFT3 | PFT4 | PFT5 | PFT6 | PFT7 | PFT8 | PFT9 | PFT10 | PFT11 | PFT12 | PFT13 | PFT14 | PFT15 |
| snowa_aged_prior | 0.5 | 0 | 0 | 0.1 | 0.37 | 0.08 | 0.16 | 0.17 | 0.27 | 0.44 | 0.44 | 0.44 | 0.44 | 0 | 0.44 |
| snowa_dec_prior | 0.13 | 0 | 0 | 0.1 | 0.1 | 0.16 | 0.04 | 0.07 | 0.08 | 0.12 | 0.12 | 0.12 | 0.12 | 0 | 0.12 |
| min(aged+dec) | 0.05 | 0 | 0 | 0.05 | 0.05 | 0.05 | 0.05 | 0.05 | 0.05 | 0.05 | 0.05 | 0.05 | 0.05 | 0 | 0.05 |
| max(aged+dec) | 0.95 | 0 | 0 | 0.95 | 0.95 | 0.95 | 0.95 | 0.95 | 0.95 | 0.95 | 0.95 | 0.95 | 0.95 | 0 | 0.95 |
| min(aged/(aged+dec)) | 0.05 | 0 | 0 | 0.05 | 0.05 | 0.05 | 0.05 | 0.05 | 0.05 | 0.05 | 0.05 | 0.05 | 0.05 | 0 | 0.05 |
| max(aged/(aged+dec)) | 0.95 | 0 | 0 | 0.95 | 0.95 | 0.95 | 0.95 | 0.95 | 0.95 | 0.95 | 0.95 | 0.95 | 0.95 | 0 | 0.95 |
| snowa_aged_post | 0.385 | 0 | 0 | 0.203 | 0.902 | 0.133 | 0.175 | 0.438 | 0.259 | 0.636 | 0.698 | 0.536 | 0.615 | 0 | 0.579 |
| snowa_dec_post | 0.163 | 0 | 0 | 0.0107 | 0.0475 | 0.00699 | 0.0092 | 0.0231 | 0.0136 | 0.0335 | 0.0368 | 0.0282 | 0.0324 | 0 | 0.0305 |
| SNOW_ALB_VIS | PFT1 | PFT2 | PFT3 | PFT4 | PFT5 | PFT6 | PFT7 | PFT8 | PFT9 | PFT10 | PFT11 | PFT12 | PFT13 | PFT14 | PFT15 |
| snowa_aged_prior | 0.74 | 0 | 0 | 0.08 | 0.24 | 0.07 | 0.18 | 0.18 | 0.33 | 0.57 | 0.57 | 0.57 | 0.57 | 0 | 0.57 |
| snowa_dec_prior | 0.21 | 0 | 0 | 0.14 | 0.08 | 0.17 | 0.05 | 0.06 | 0.09 | 0.15 | 0.15 | 0.15 | 0.15 | 0 | 0.15 |
| min(aged+dec) | 0.05 | 0 | 0 | 0.05 | 0.05 | 0.05 | 0.05 | 0.05 | 0.05 | 0.05 | 0.05 | 0.05 | 0.05 | 0 | 0.05 |
| max(aged+dec) | 0.95 | 0 | 0 | 0.95 | 0.95 | 0.95 | 0.95 | 0.95 | 0.95 | 0.95 | 0.95 | 0.95 | 0.95 | 0 | 0.95 |
| min(aged/(aged+dec)) | 0.05 | 0 | 0 | 0.05 | 0.05 | 0.05 | 0.05 | 0.05 | 0.05 | 0.05 | 0.05 | 0.05 | 0.05 | 0 | 0.05 |
| max(aged/(aged+dec)) | 0.95 | 0 | 0 | 0.95 | 0.95 | 0.95 | 0.95 | 0.95 | 0.95 | 0.95 | 0.95 | 0.95 | 0.95 | 0 | 0.95 |
| snowa_aged_post | 0.633 | 0 | 0 | 0.0685 | 0.902 | 0.00959 | 0.109 | 0.627 | 0.297 | 0.902 | 0.902 | 0.742 | 0.77 | 0 | 0.862 |
| snowa_dec_post | 0.234 | 0 | 0 | 0.0036 | 0.0475 | 0.0404 | 0.00575 | 0.033 | 0.0156 | 0.0475 | 0.0475 | 0.039 | 0.0405 | 0 | 0.0454 |
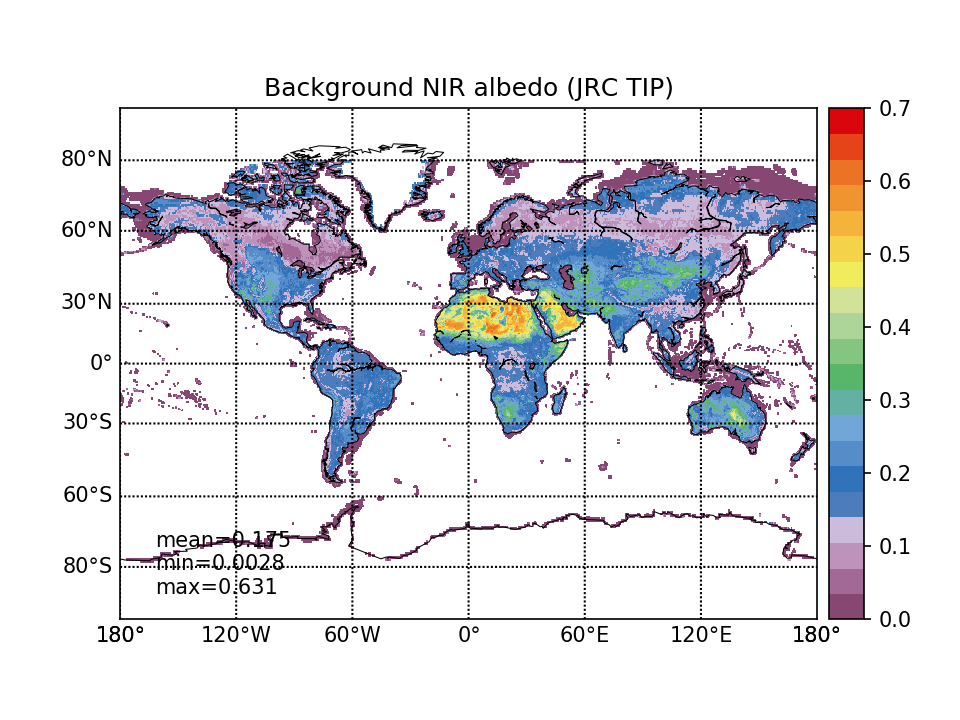
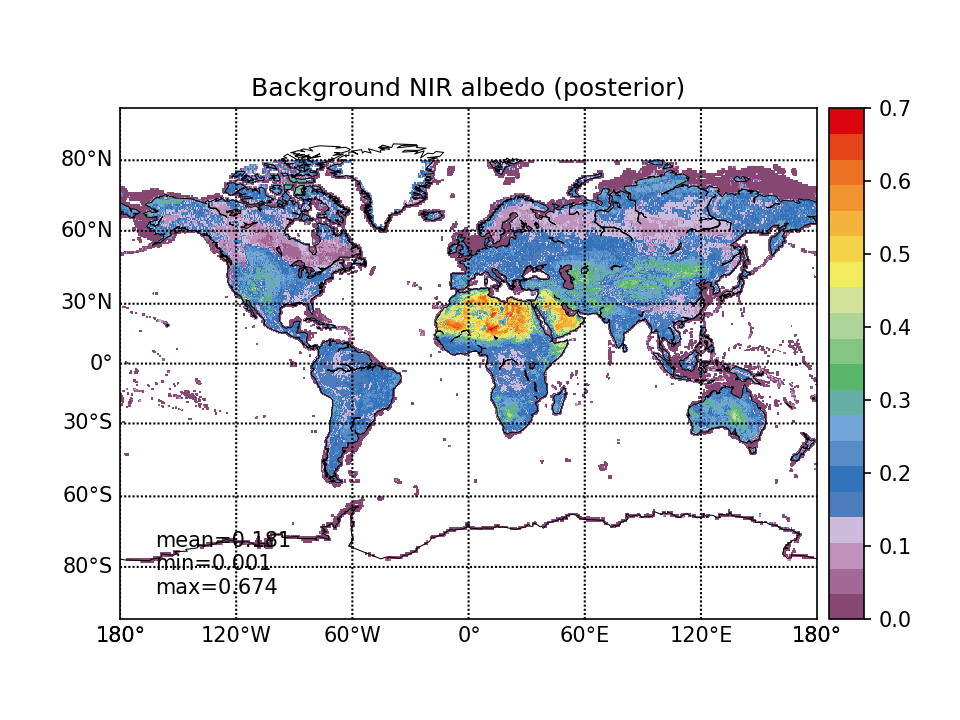
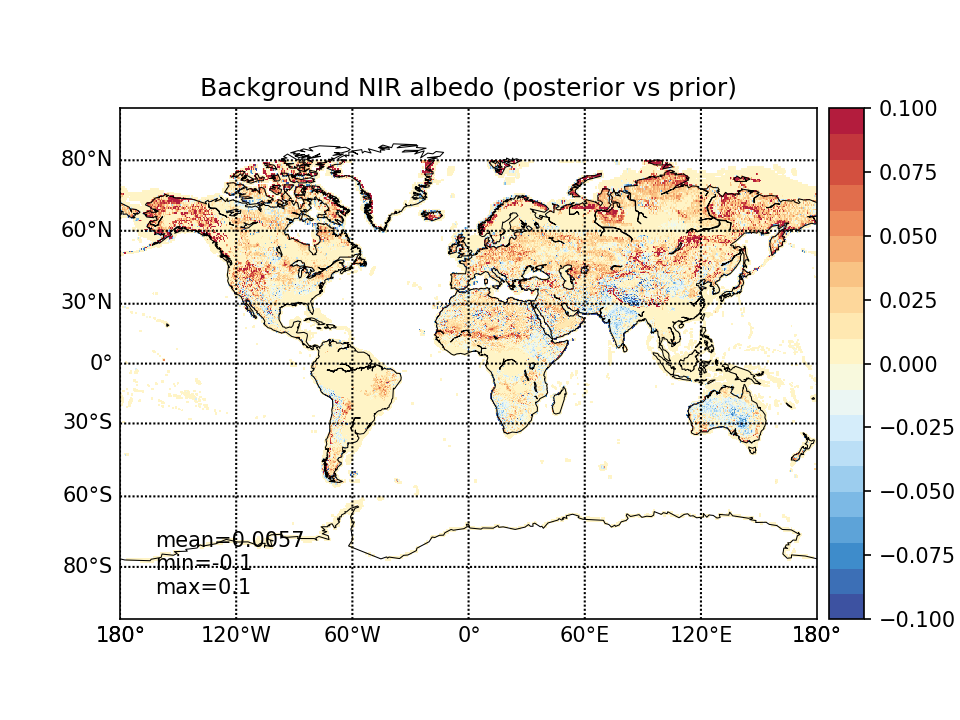
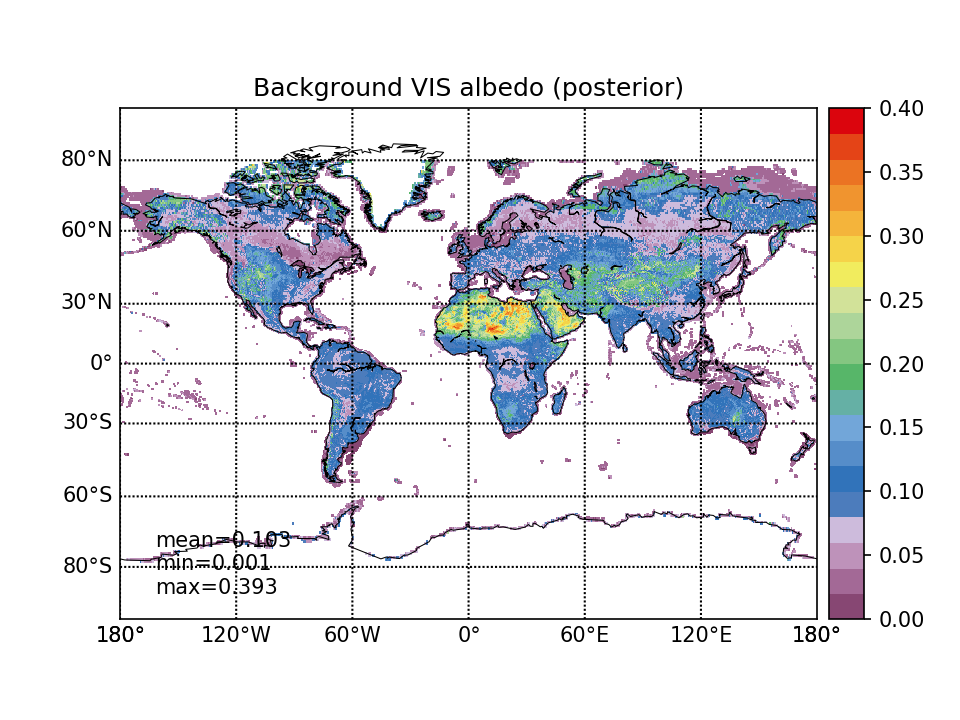
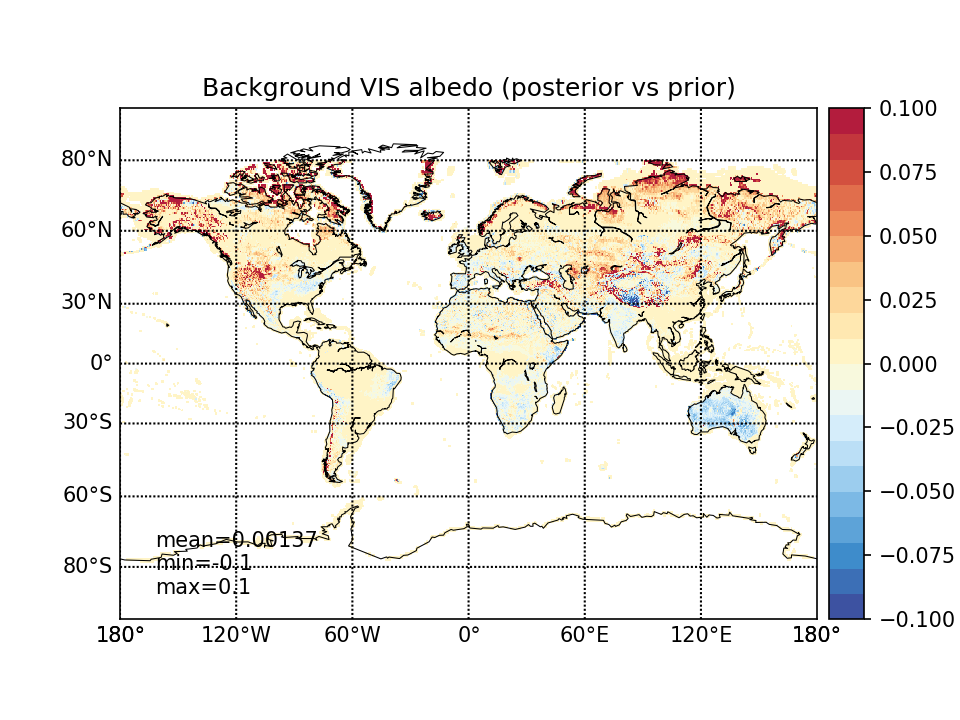
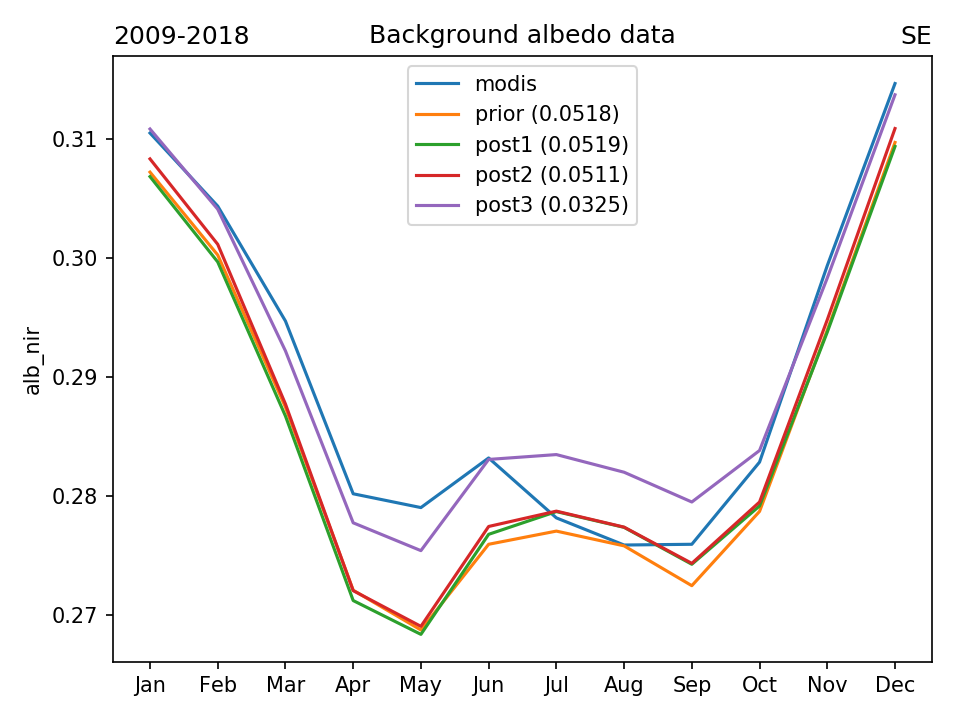
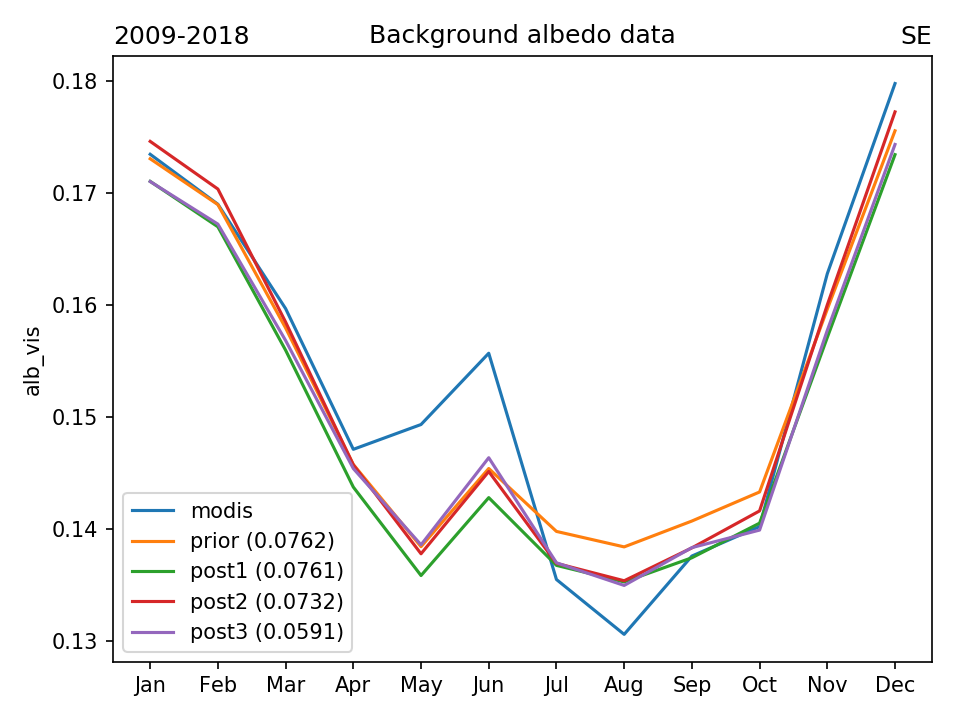
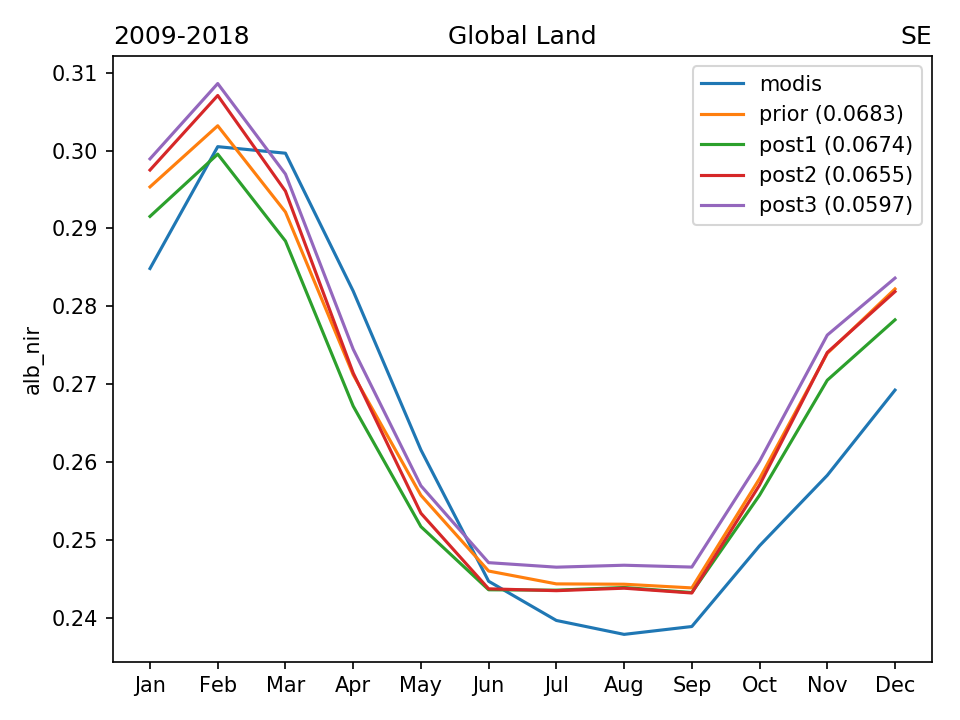
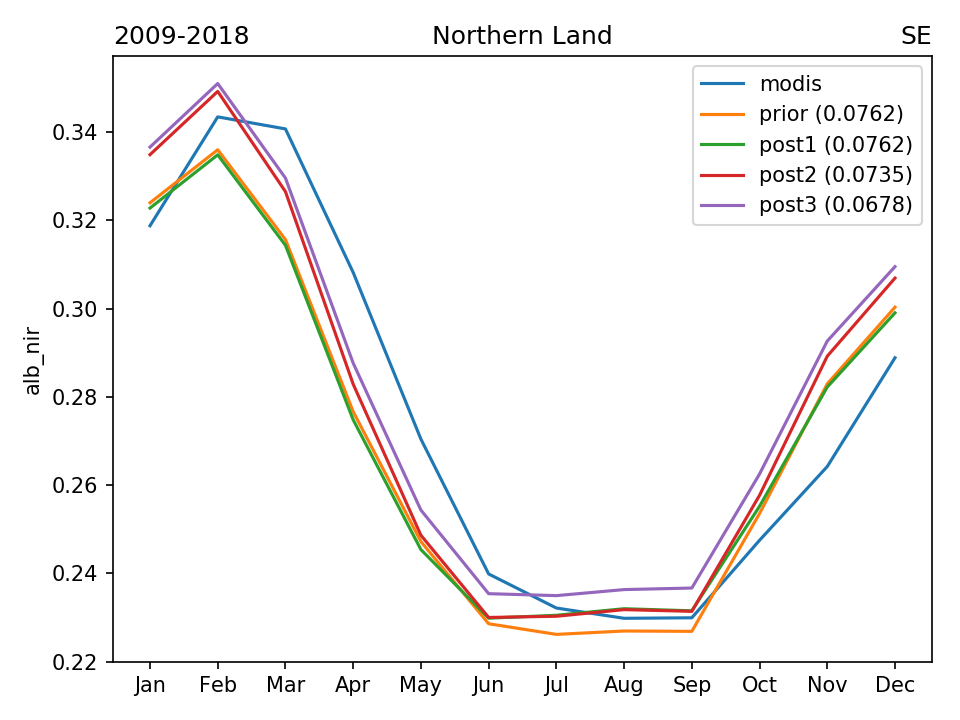
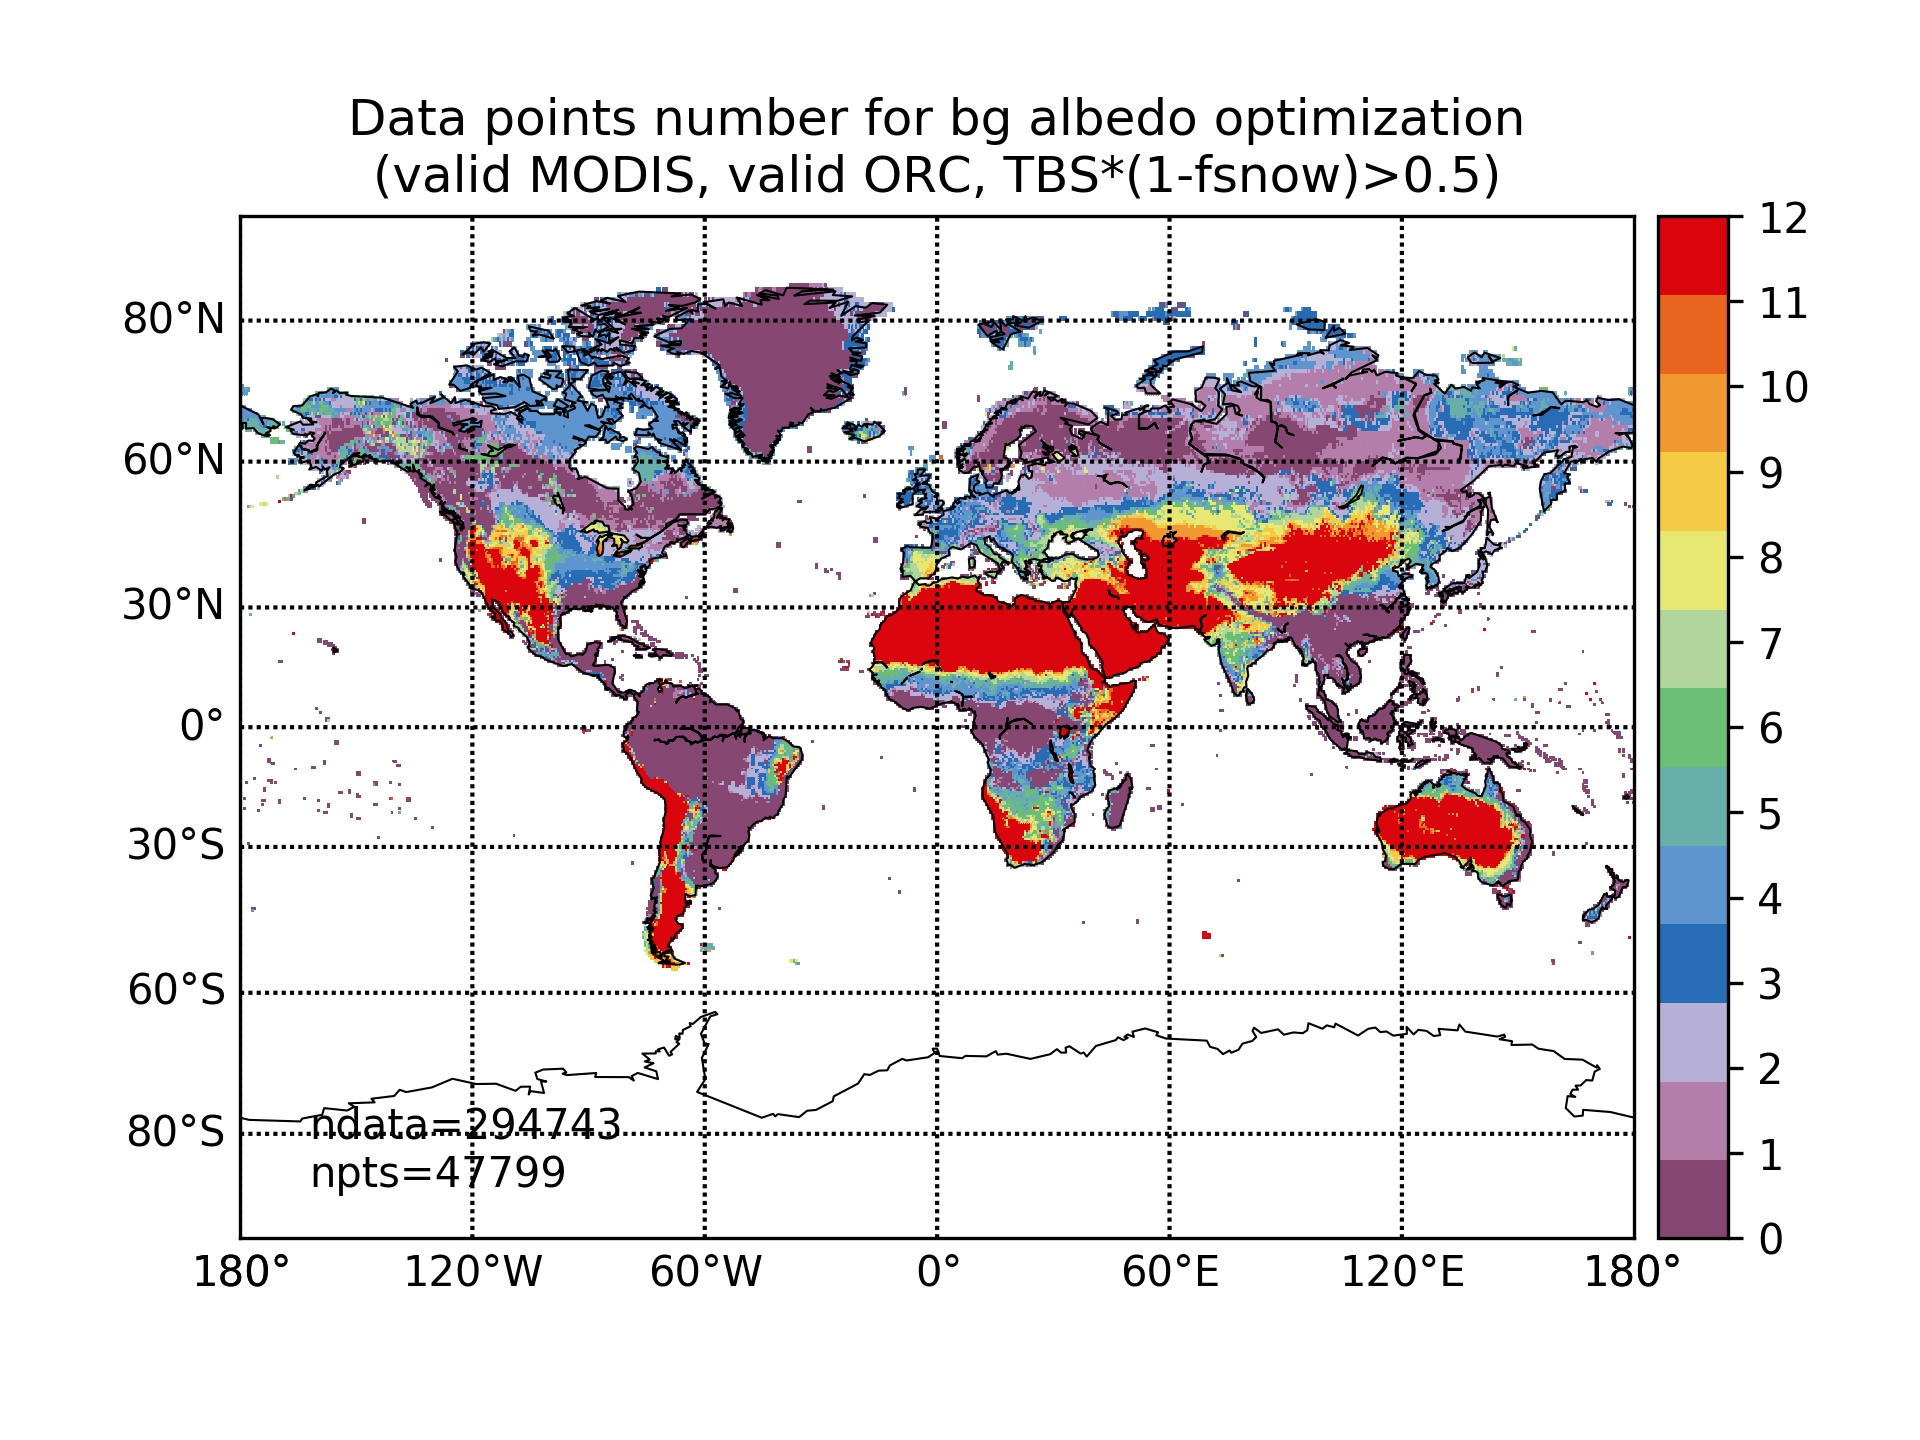
STEP 3 : BACKGROUND ALBEDO OPTIMIZATION
Data points (month-pixels) selection :
- MODIS is valid (not masked)
- ORCHIDEE is valid (not masked)
- Total_bare_soil * (1 - snow_fraction) > 0.5
The graph below shows the number of data points (months) selected at each grid cell (from 0 to 12) :
Optimization method : L-BFGS-B with 1 optimized parameter individually at each grid cell
- Prior : JRC TIP product
- Range of variation : ±0.1
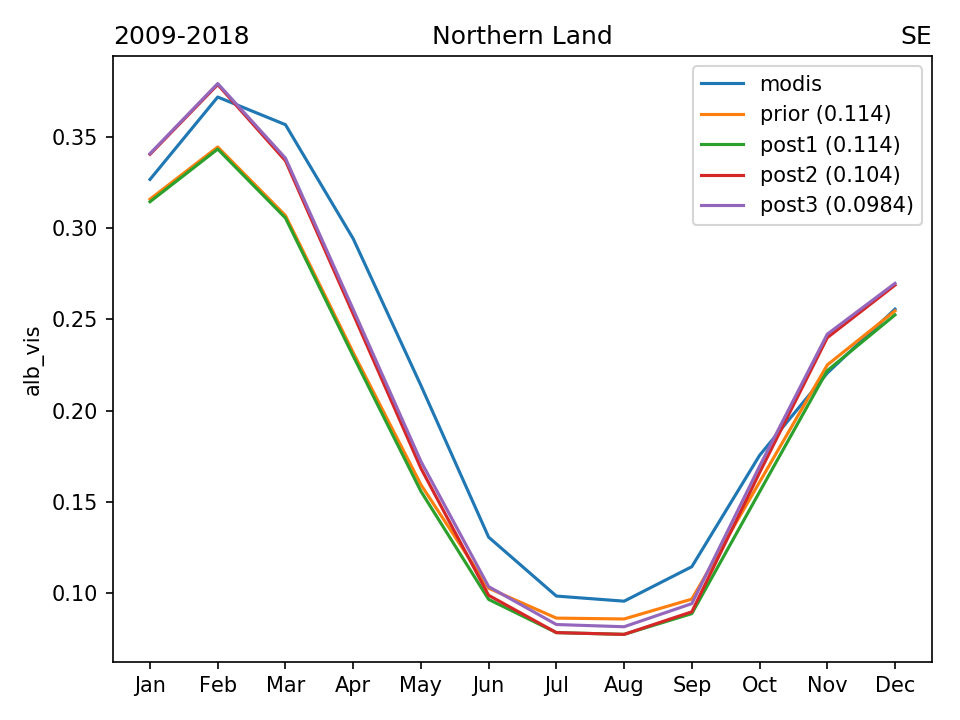
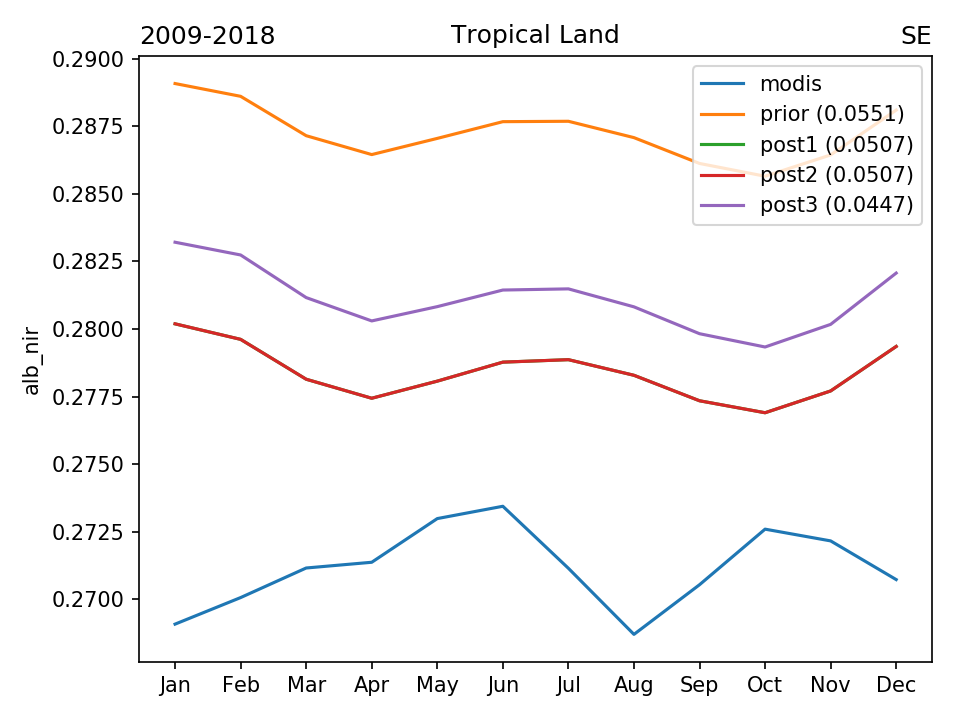
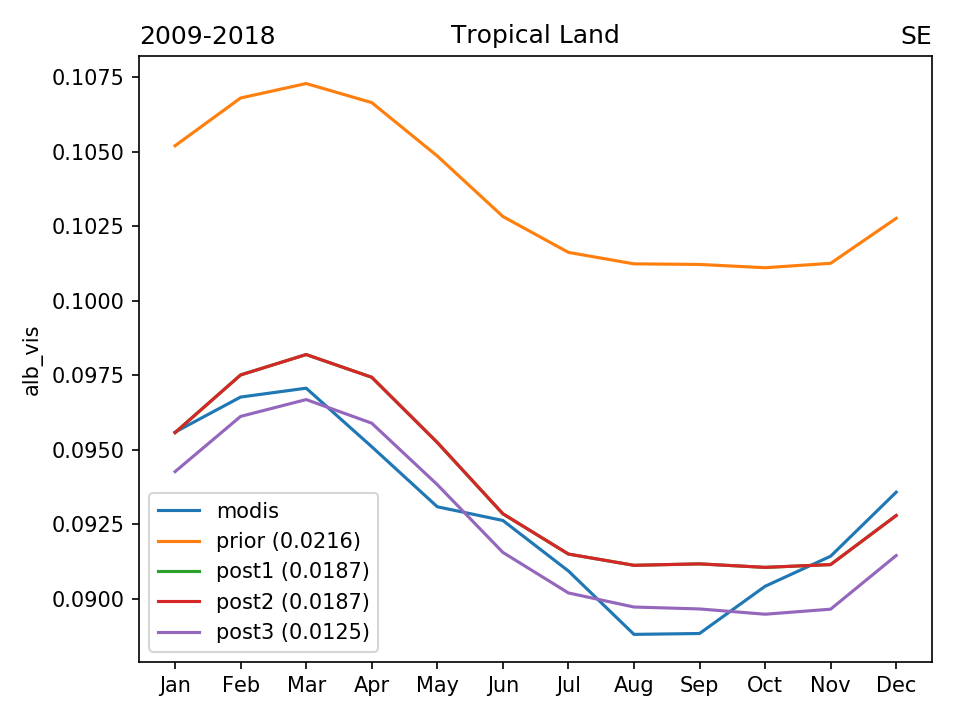
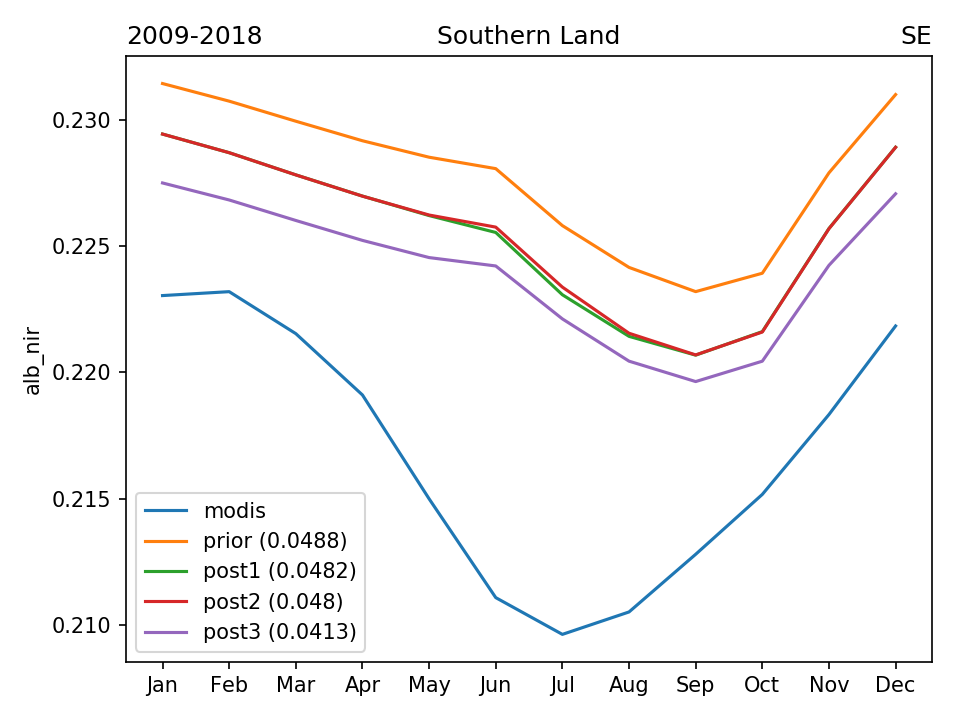
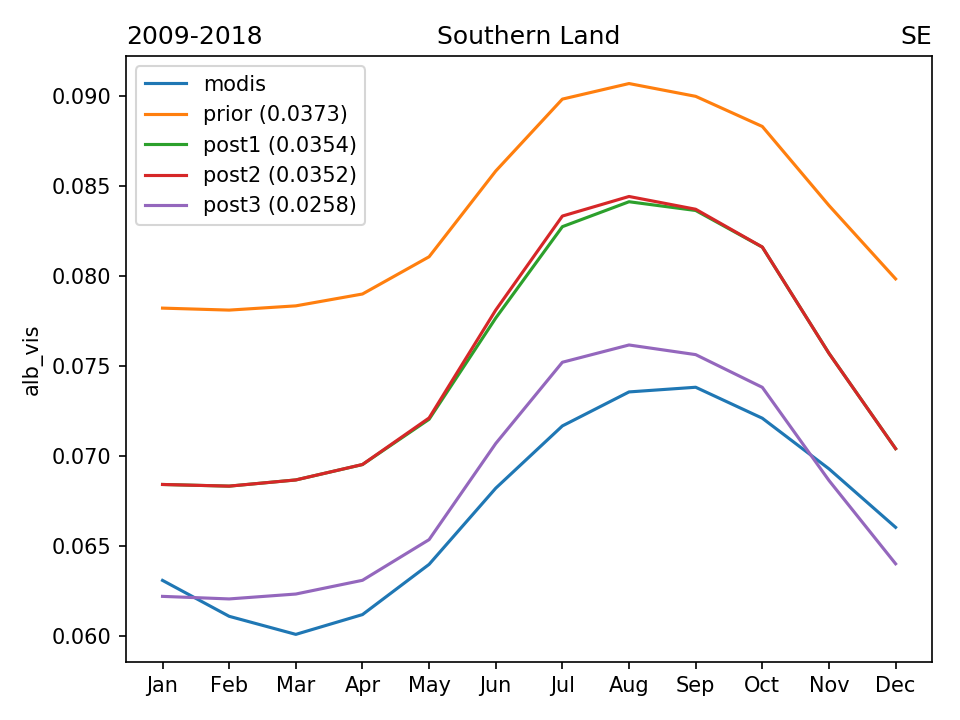
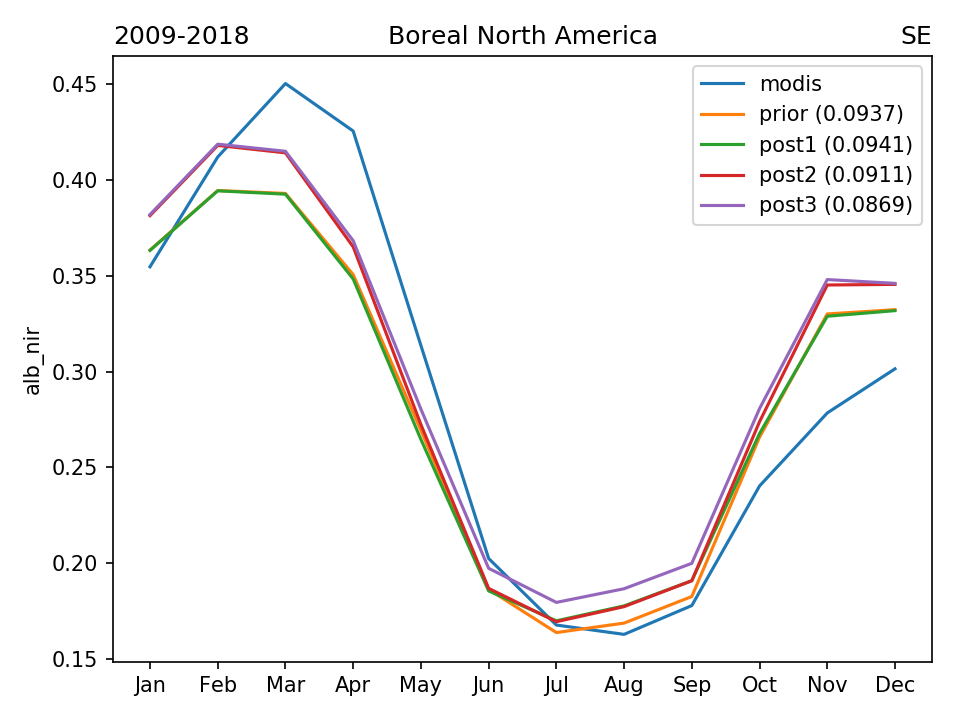
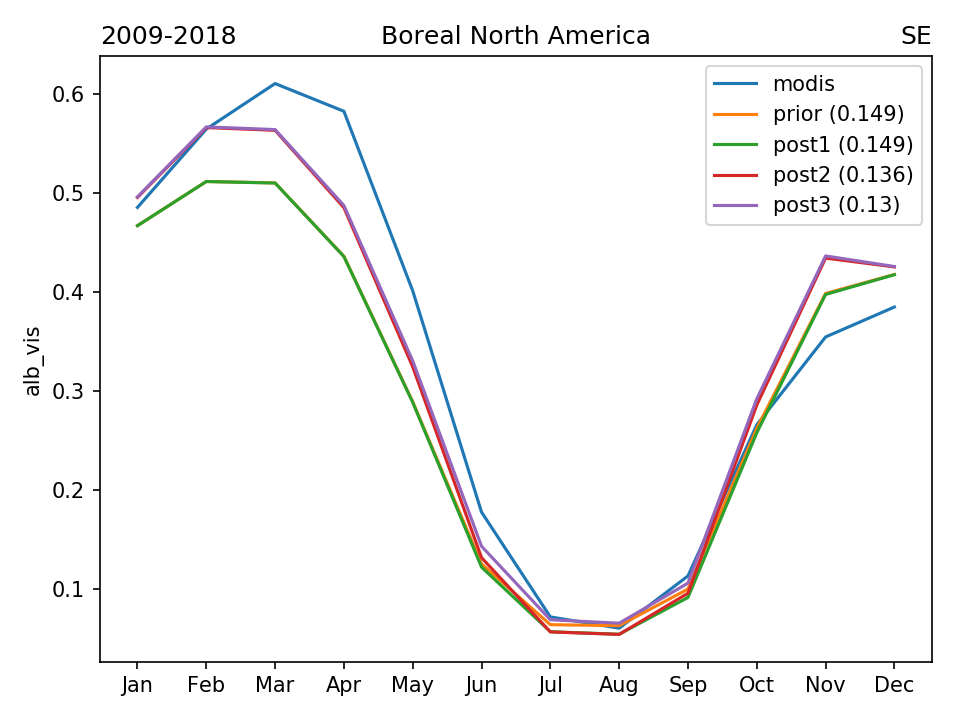
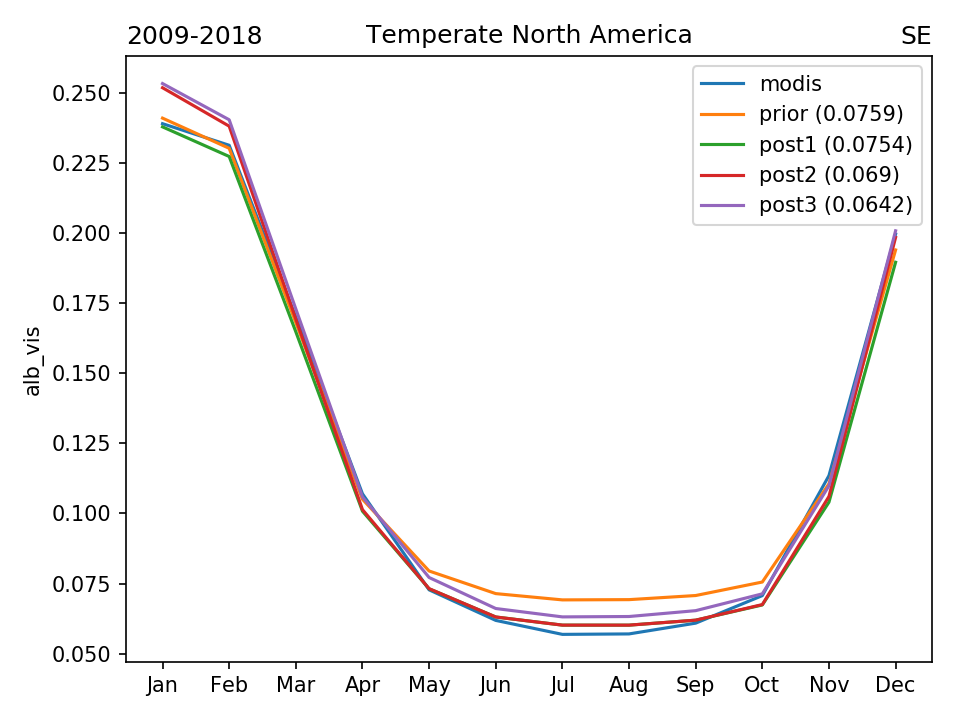
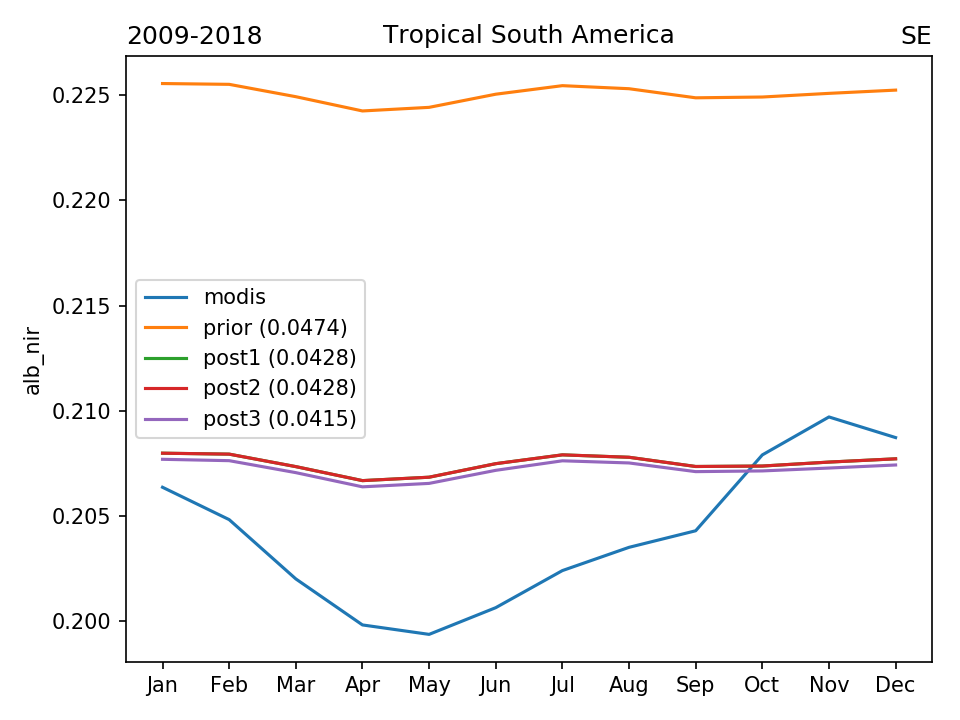
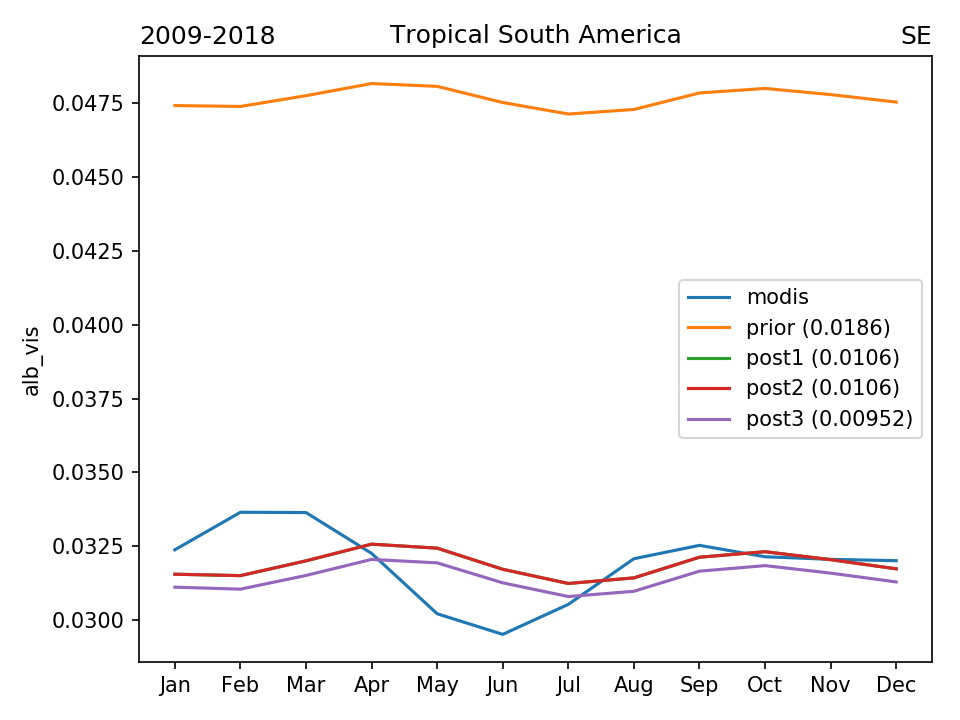
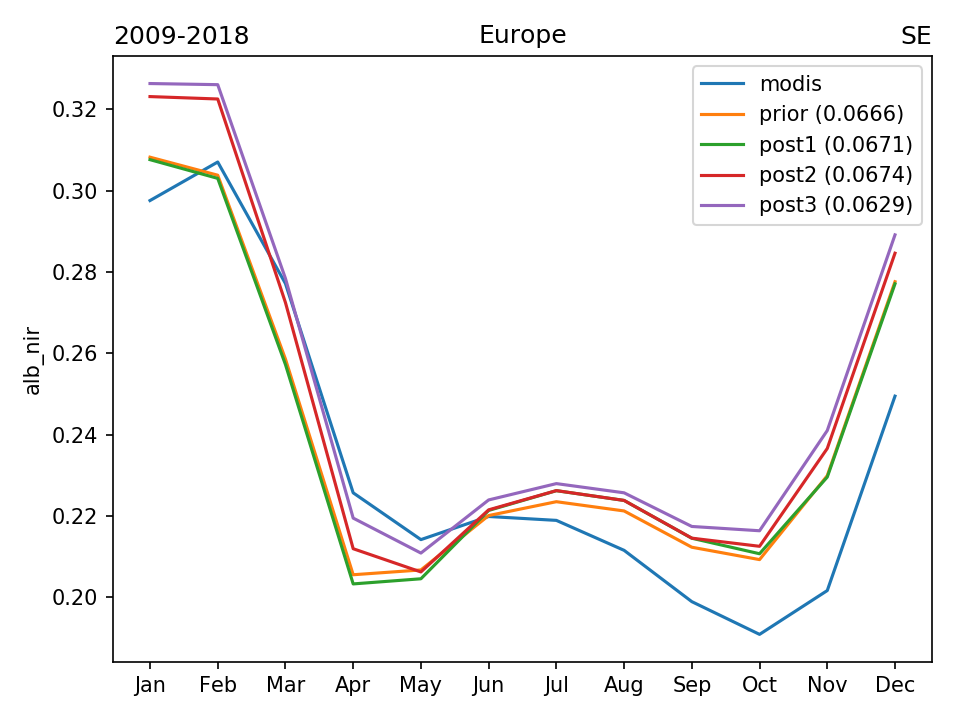
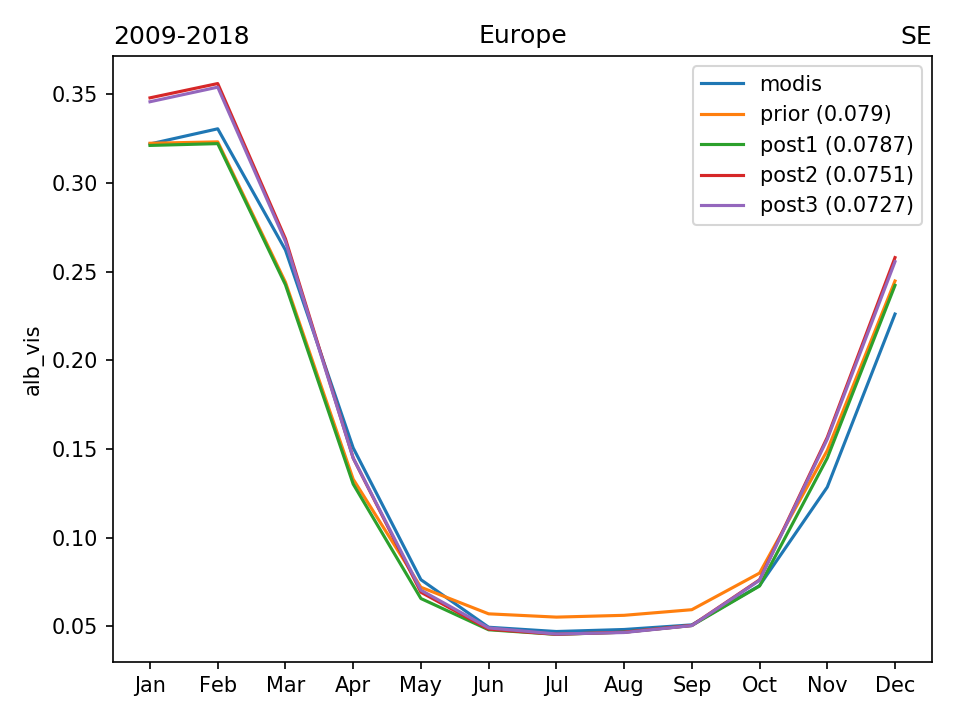
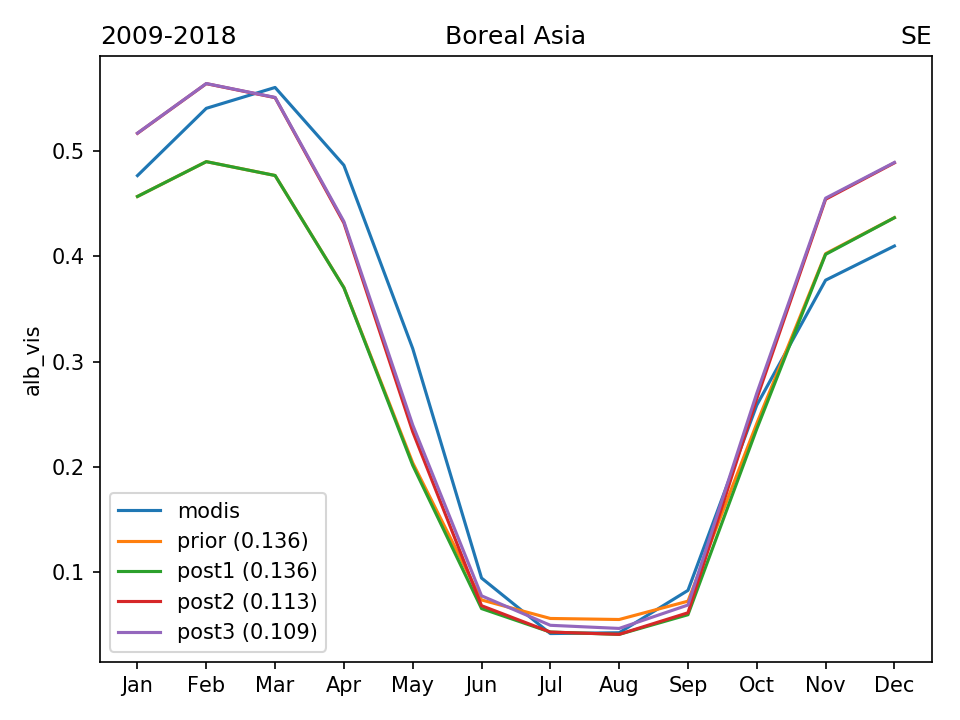
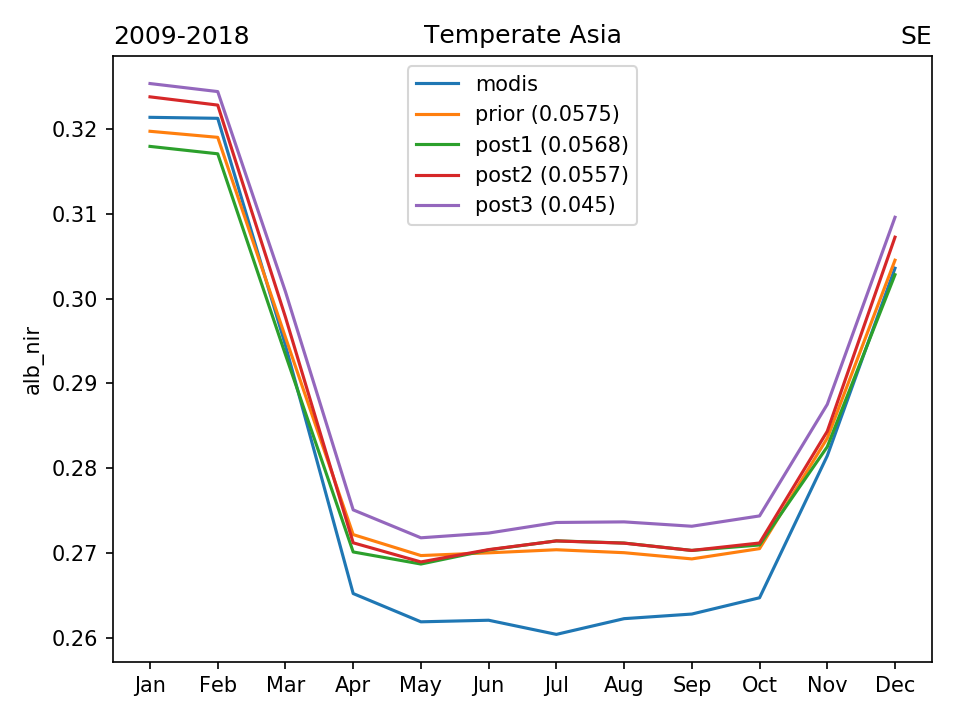
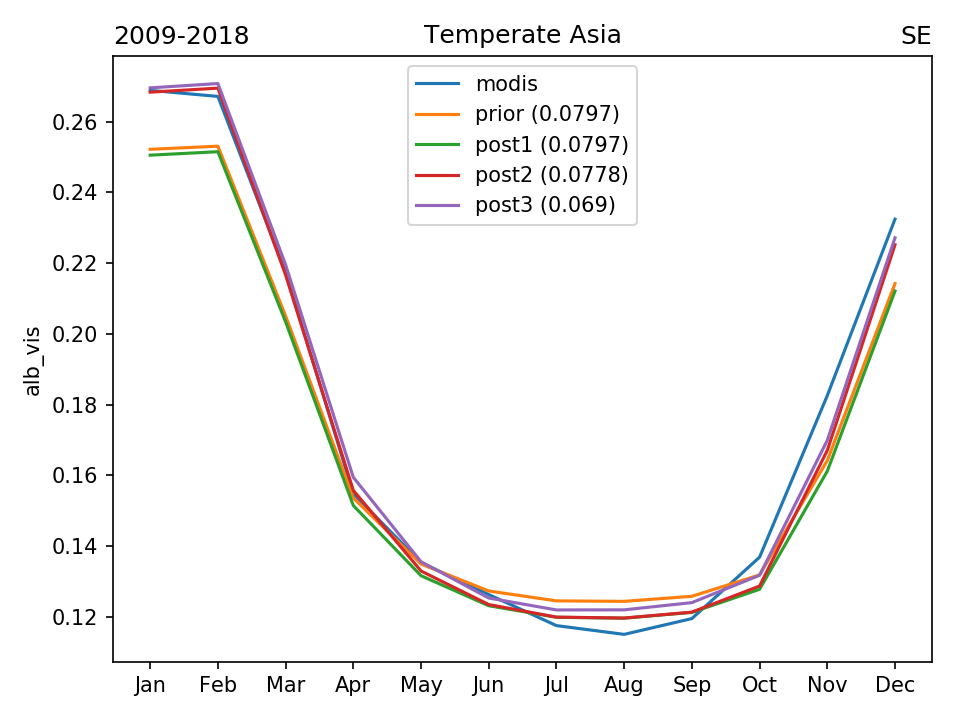
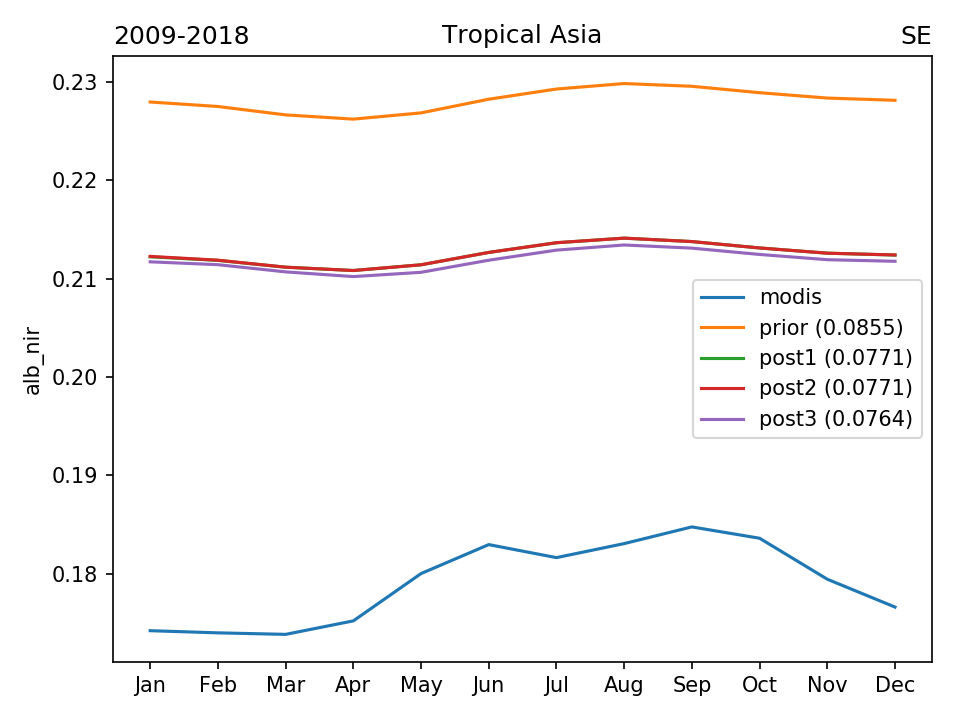
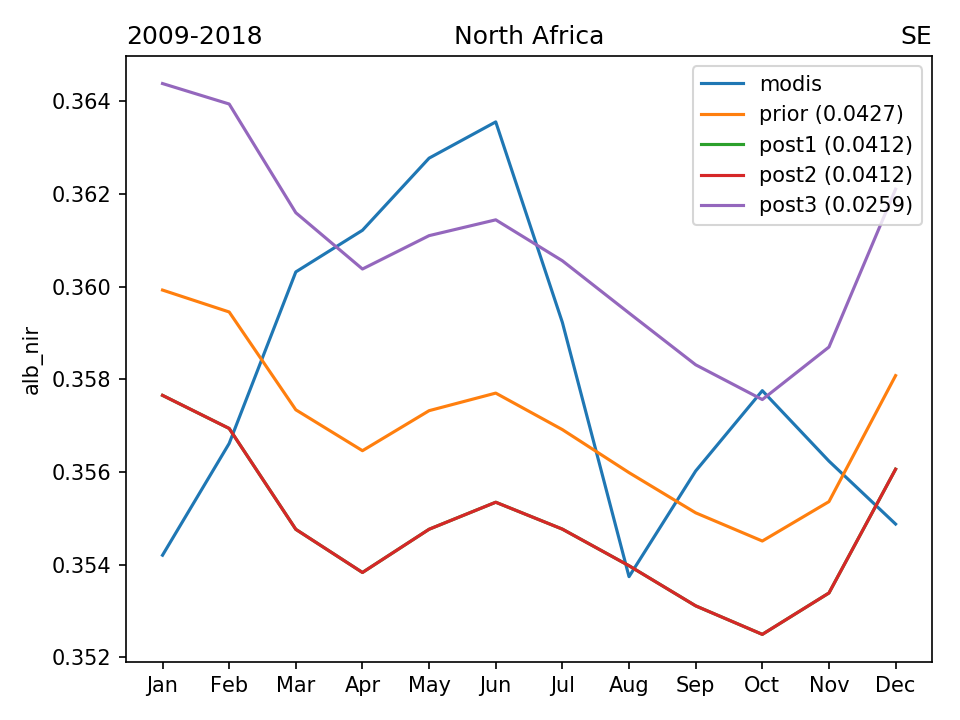
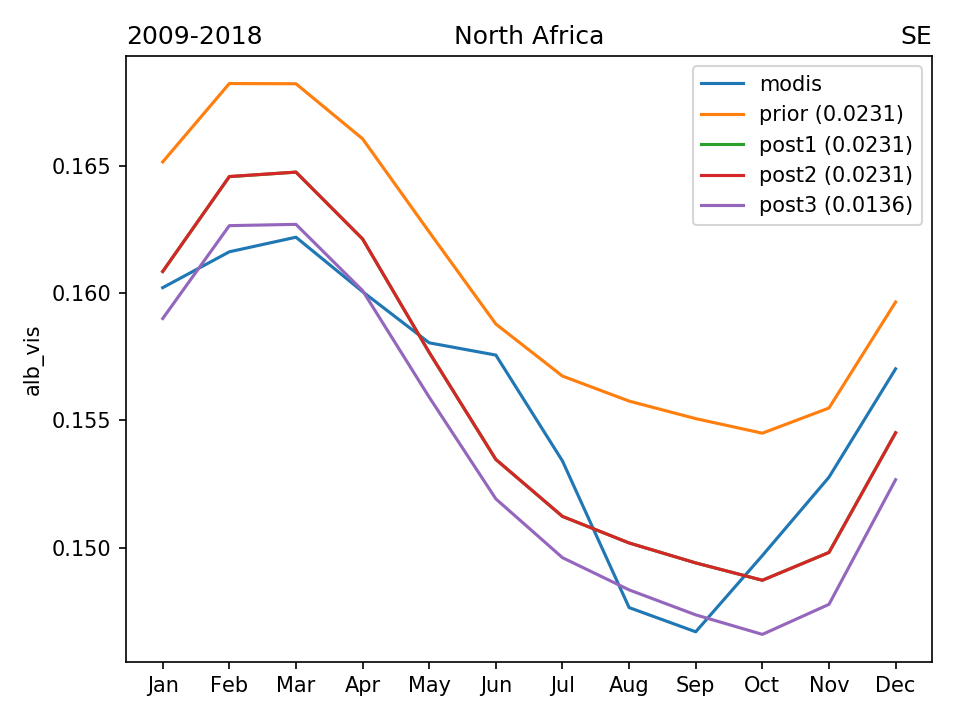
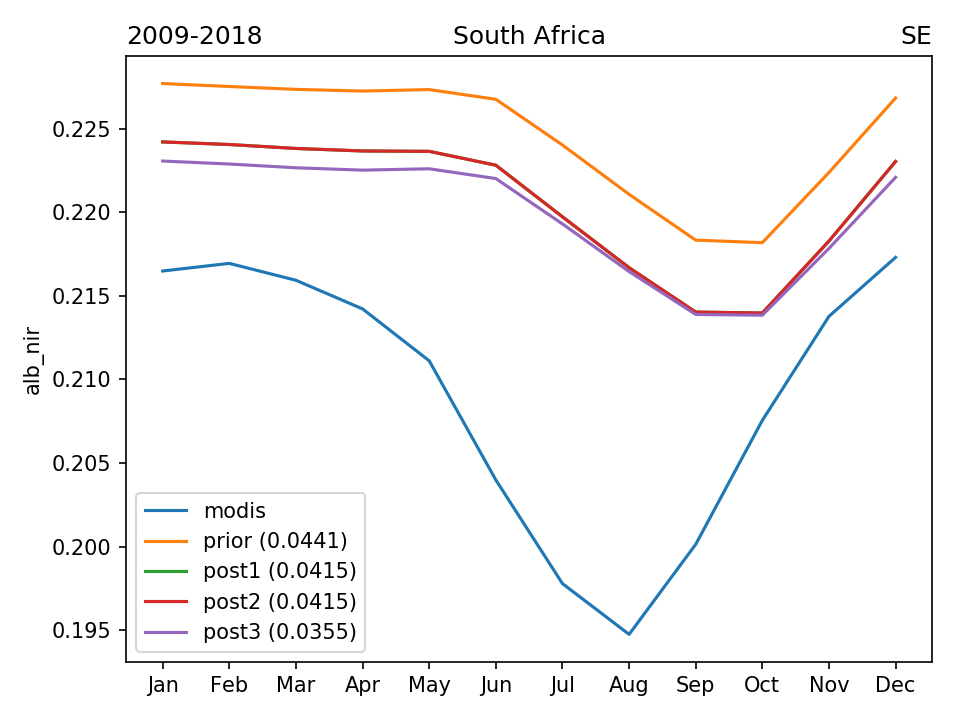
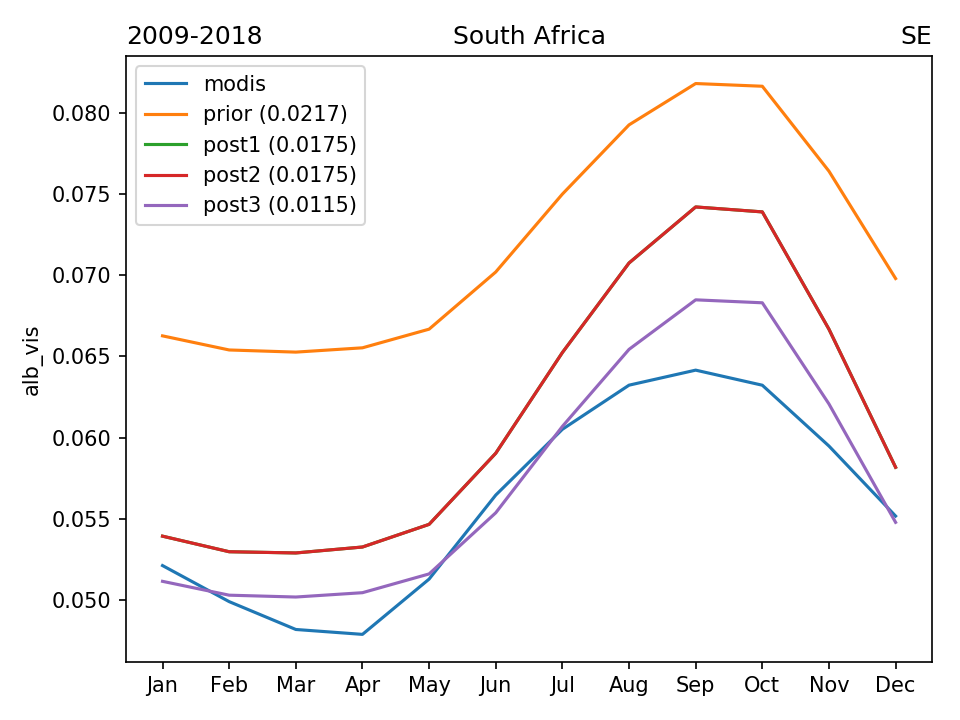
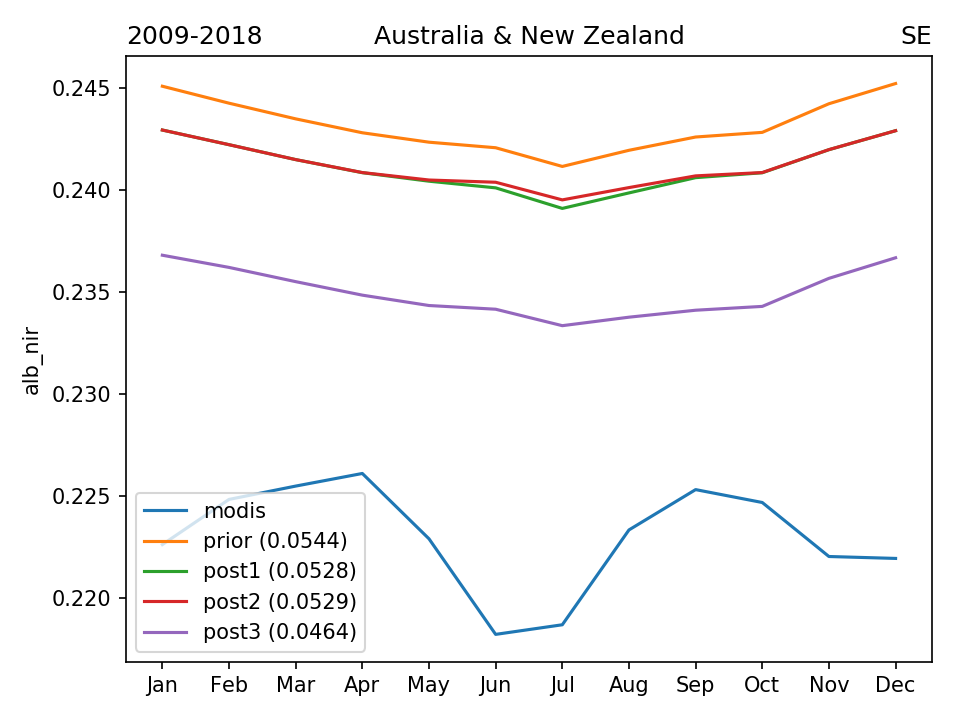
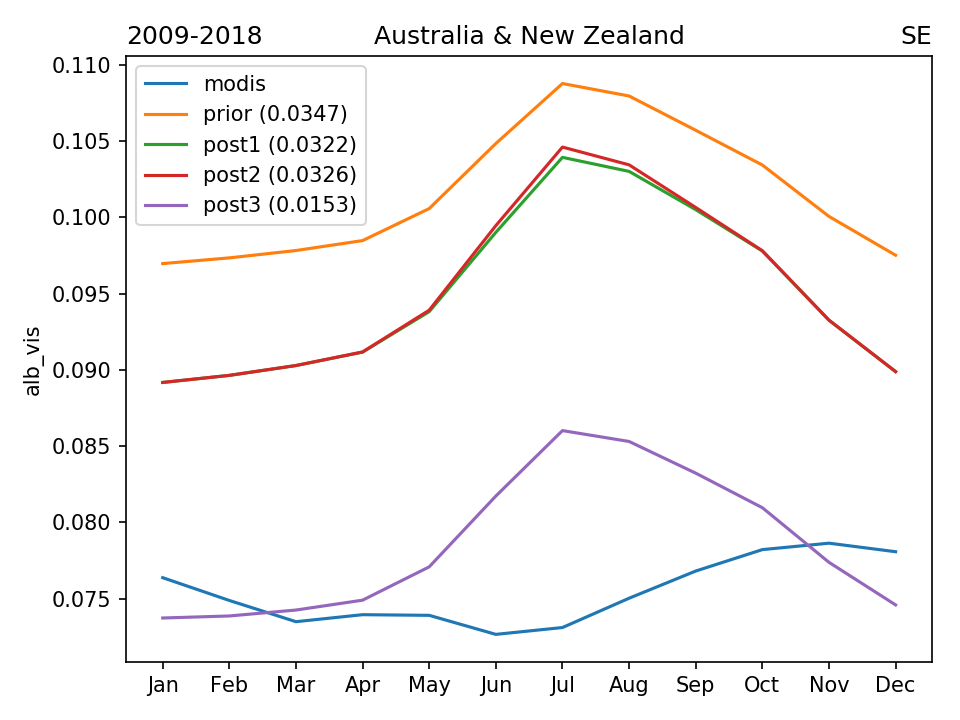
RESULTS (seasonal cycle across different regional masks)