|
|
- Modelling approach
Optimization of CH4 wetland fluxes for all PFTs, Koeppen-Geiger classes (using the updated KGC map) and boxes by fitting individual models for
- whole PFT (sum of all points of the examined PFT)
- KG class and box (North – South)
- Sections
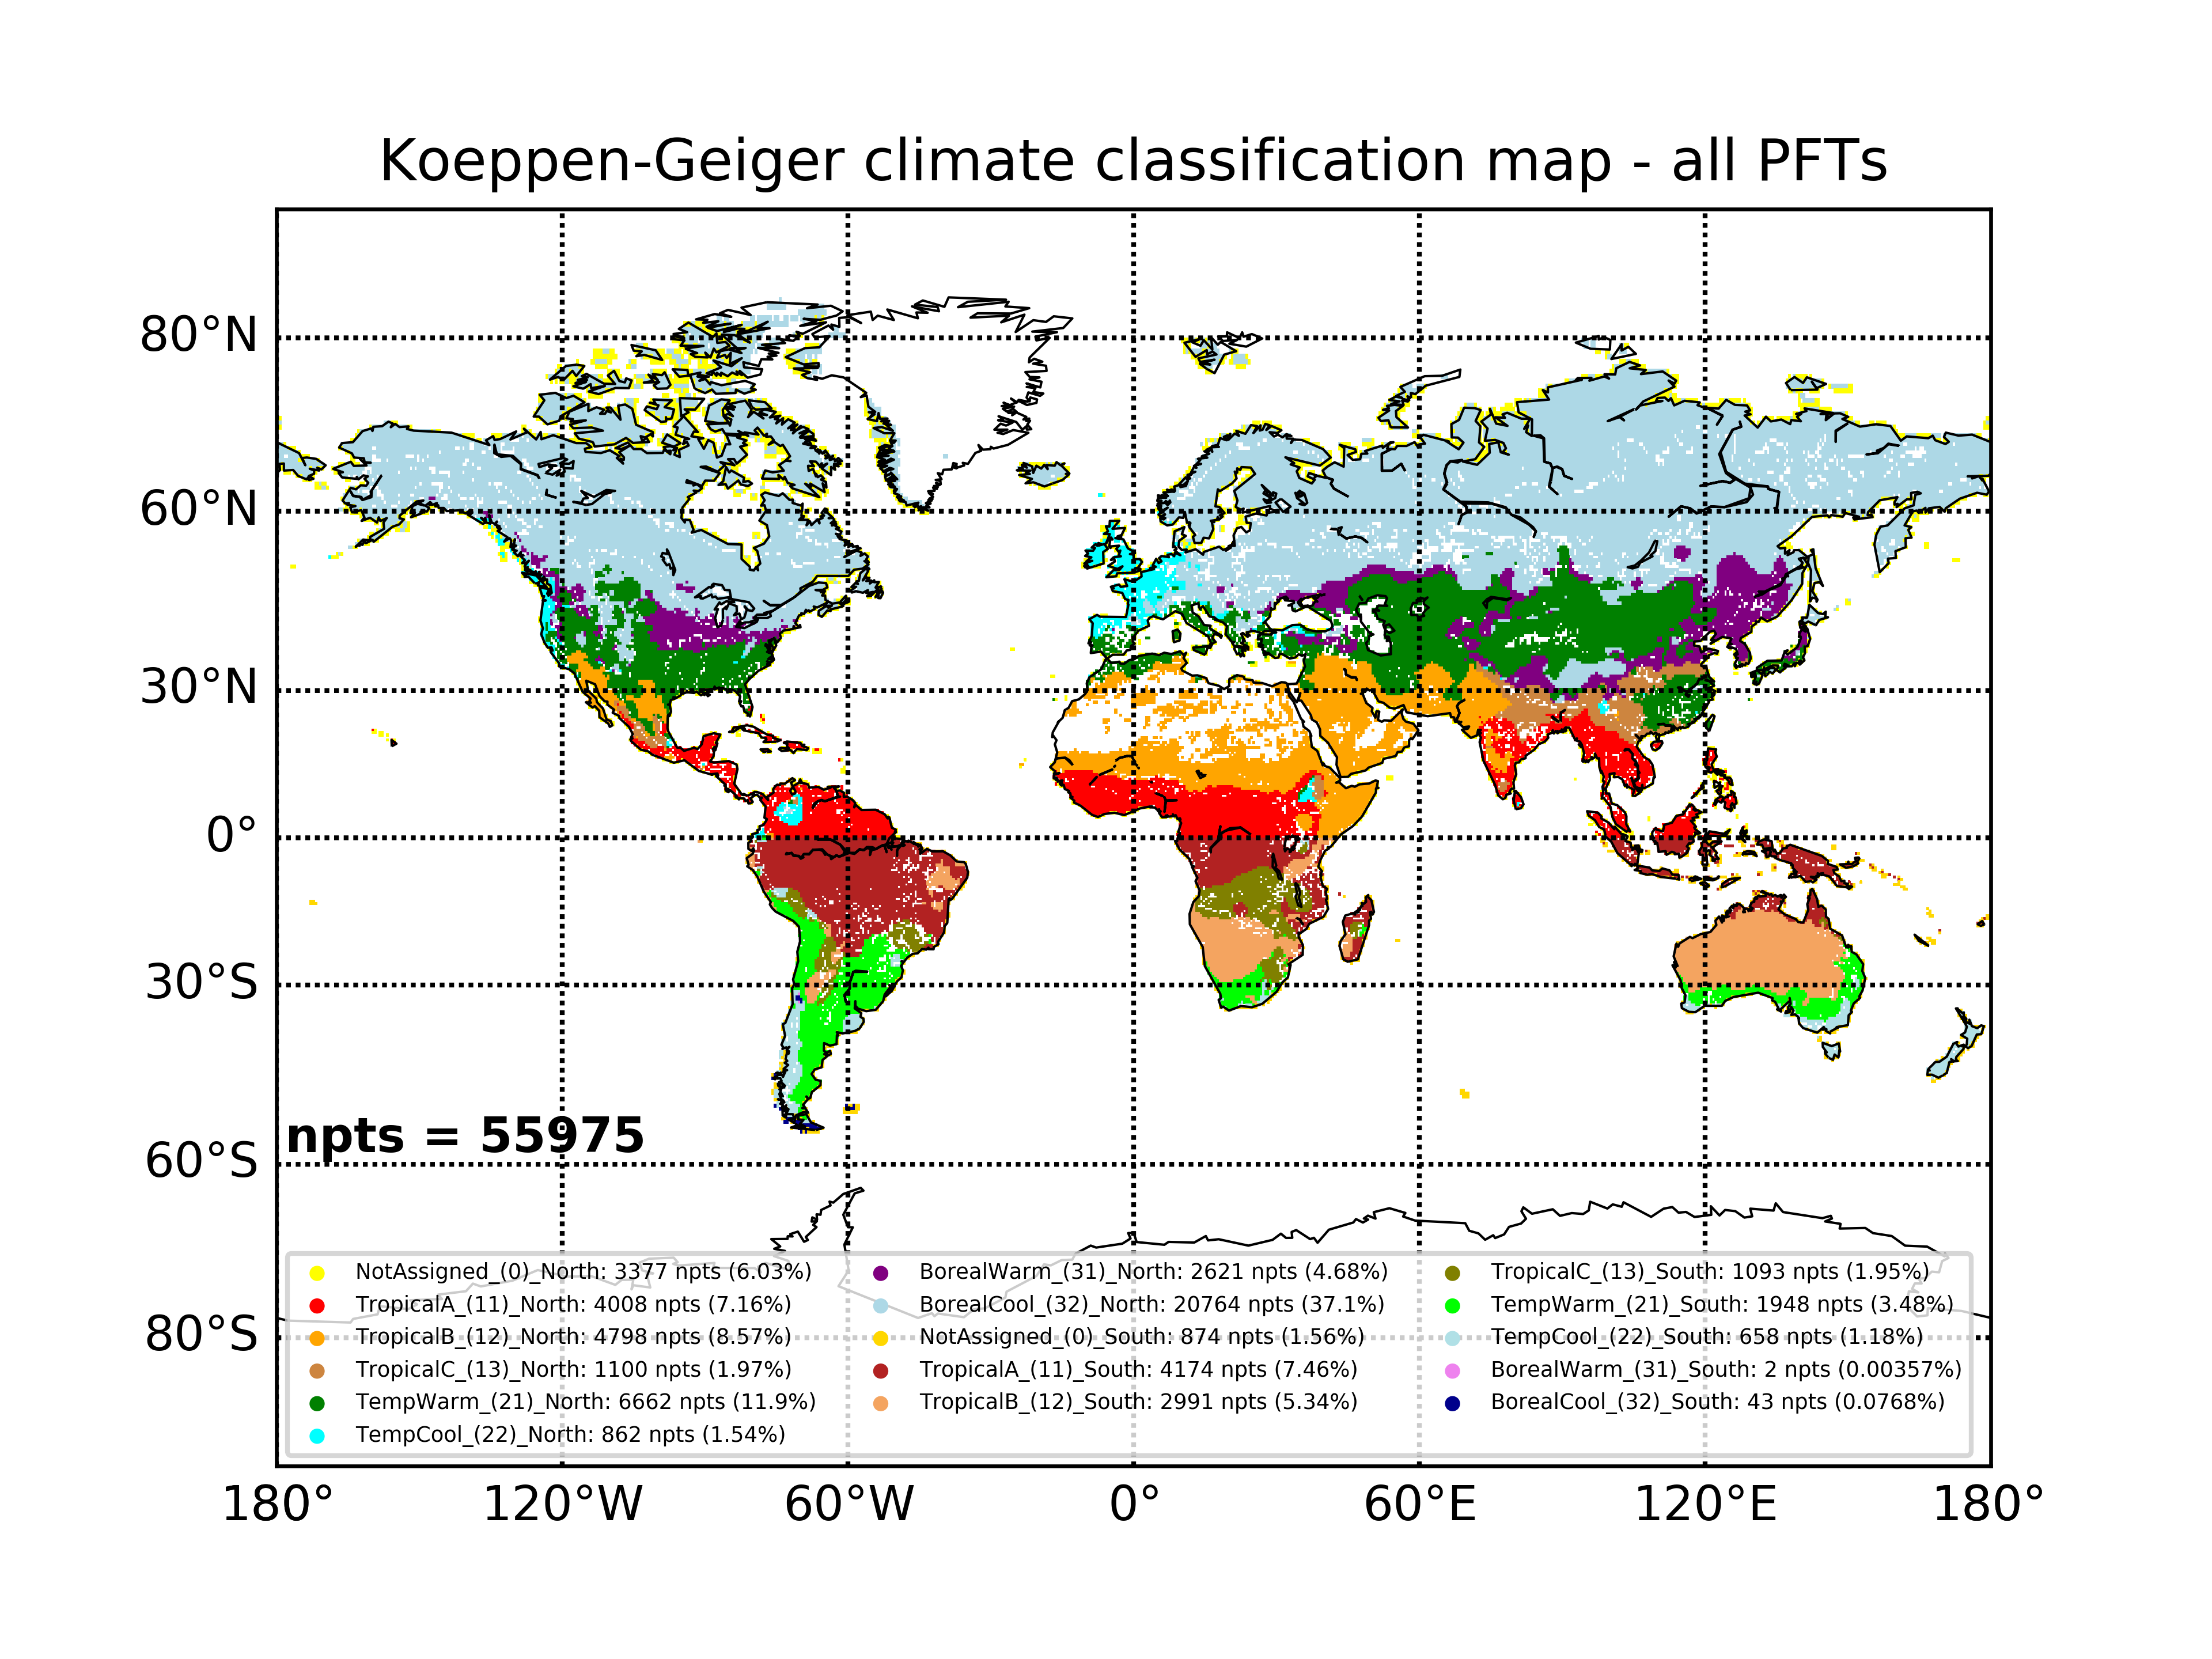
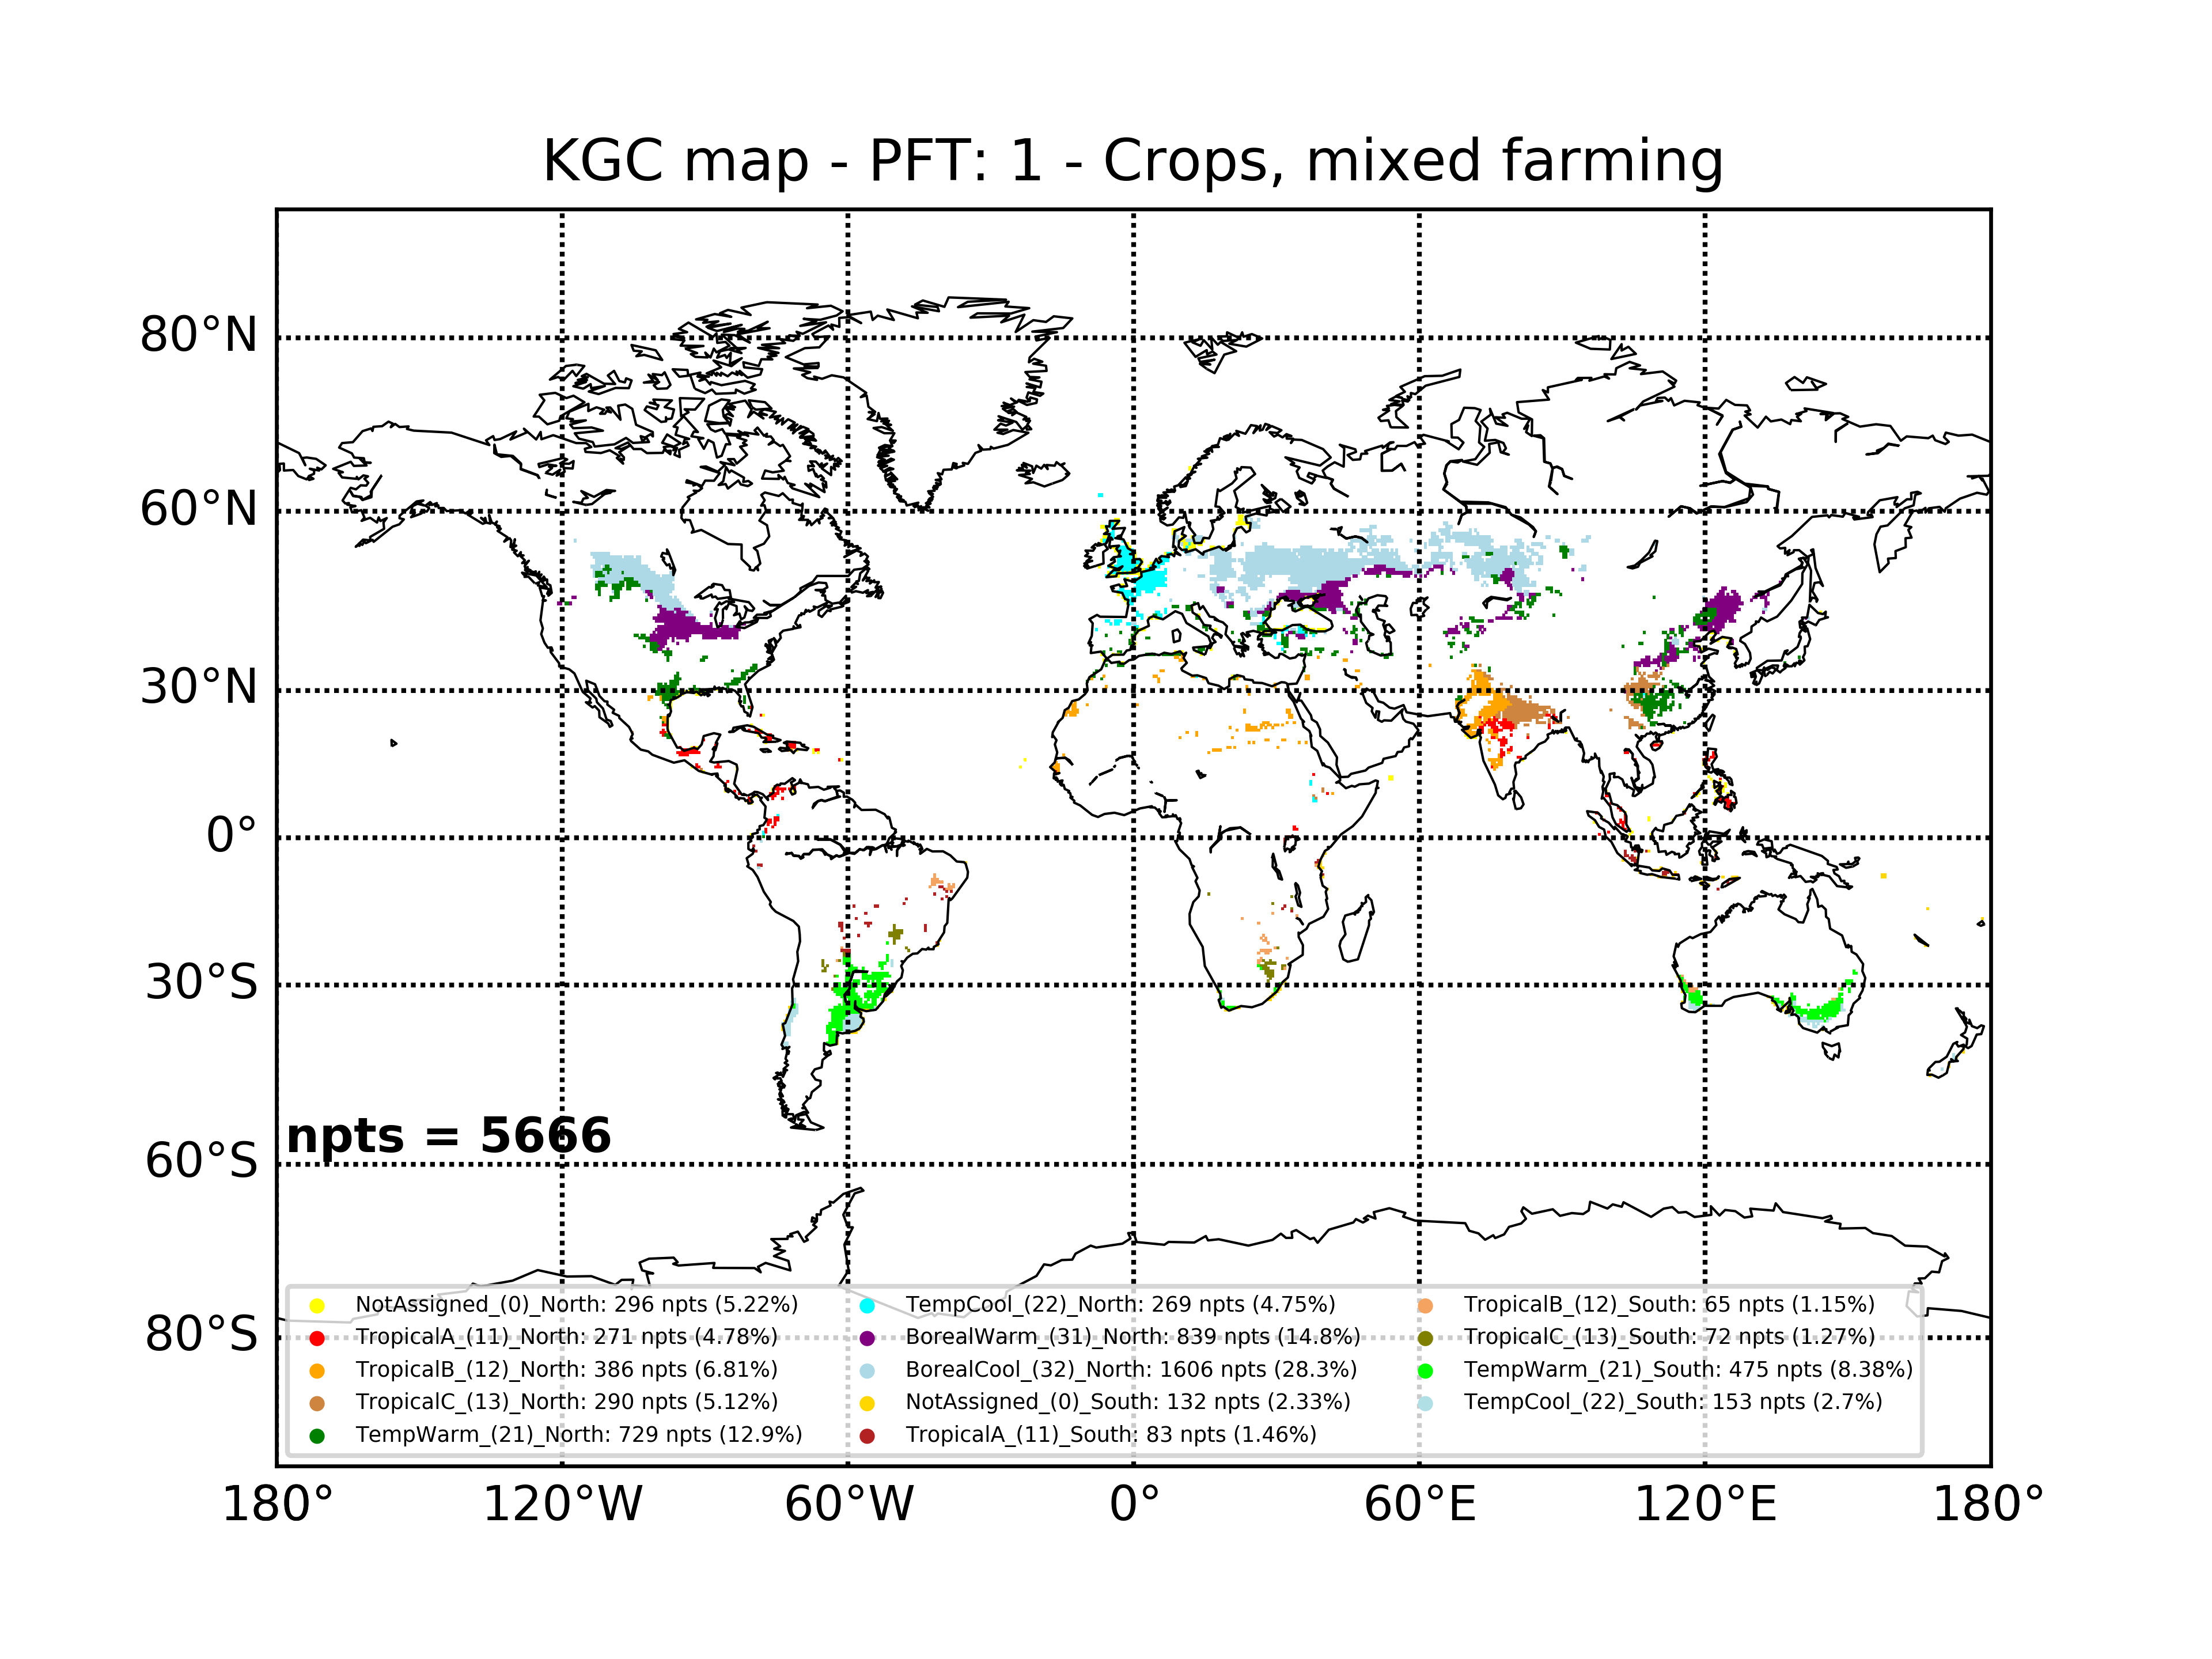
- Section 1 : PFT map
Initially a KGC map is provided with all the KG classes and their number of points (and their percentage) assigned on the specific PFT
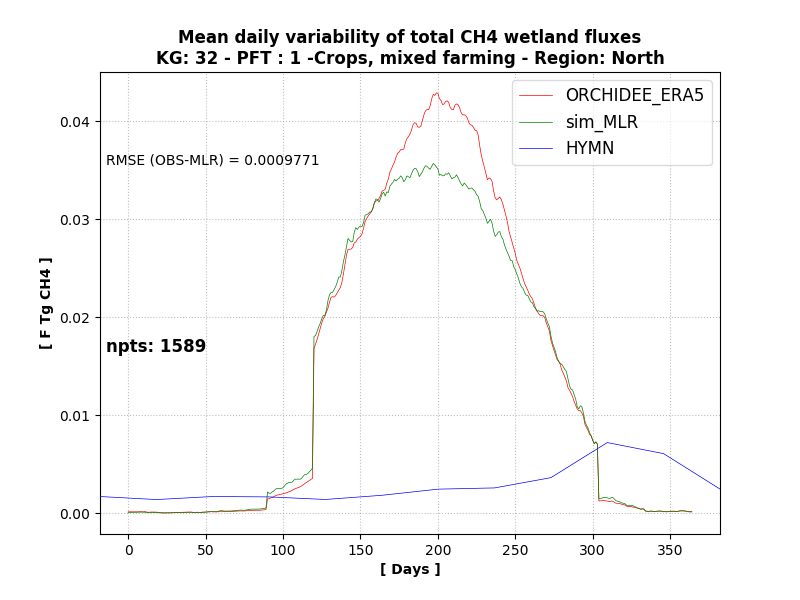
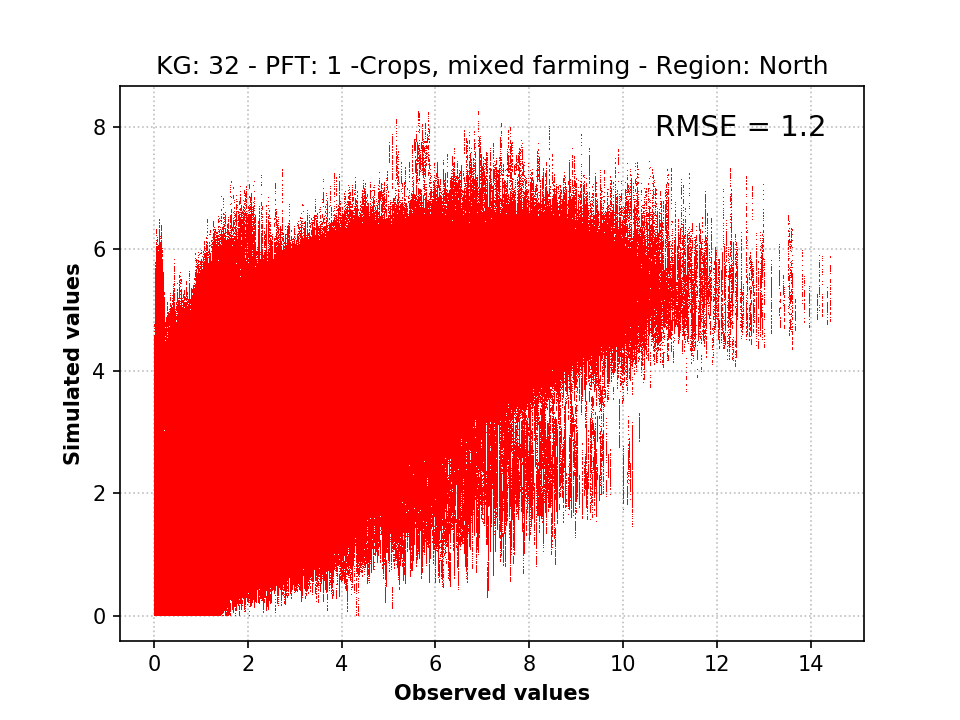
- Section 2 : CH4 variability for total PFT
A single model is fitted using the whole number of points (npts) of the specific PFT
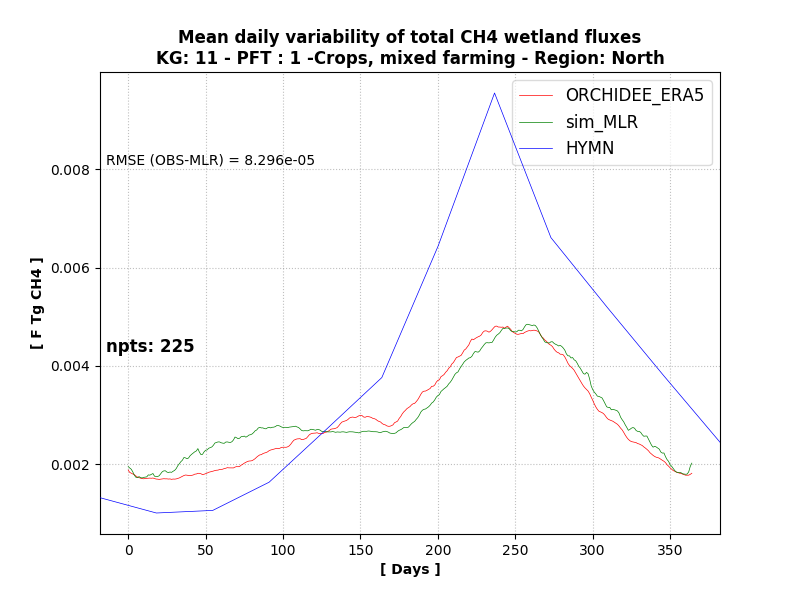
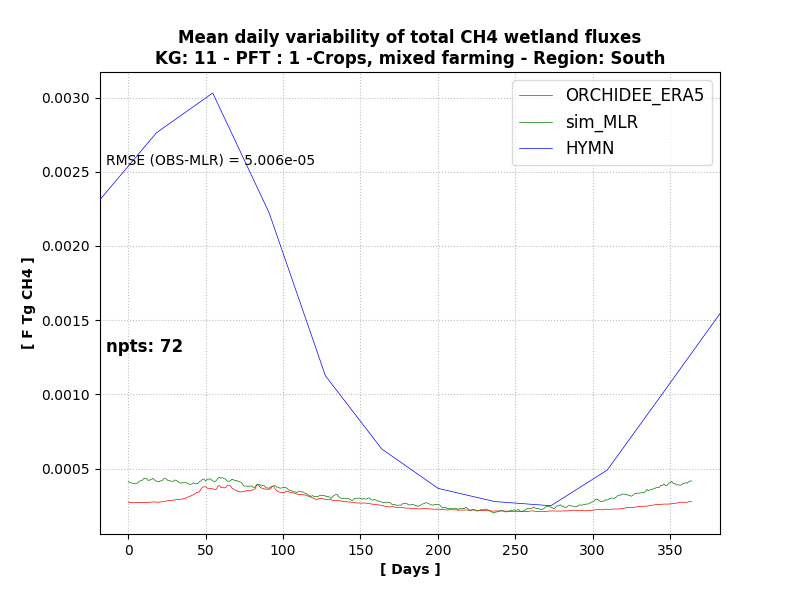
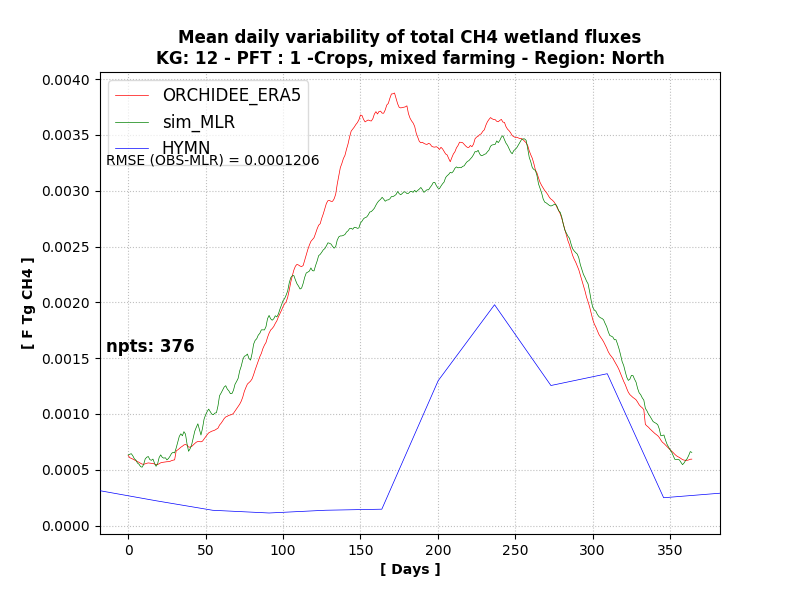
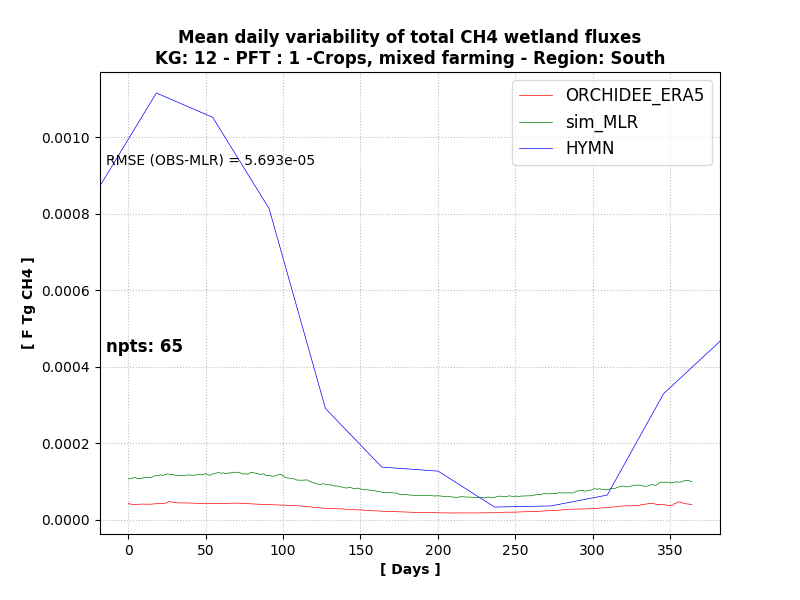
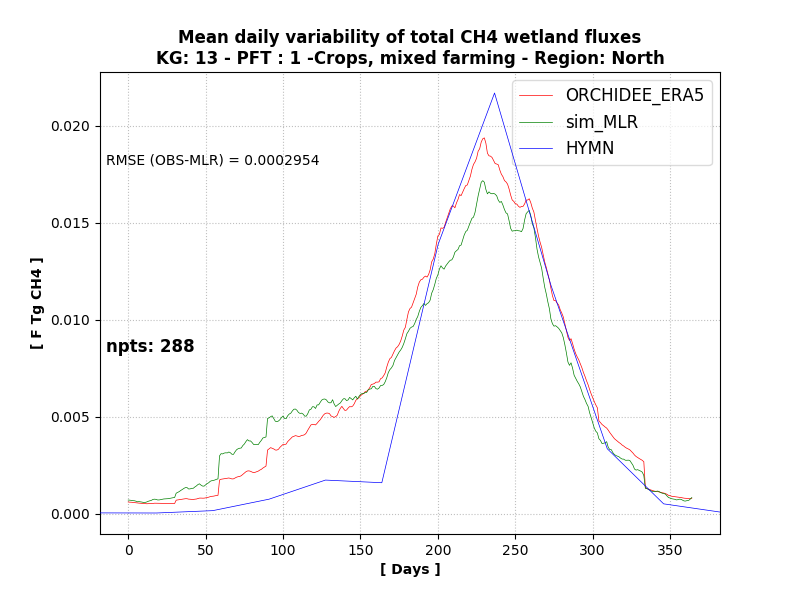
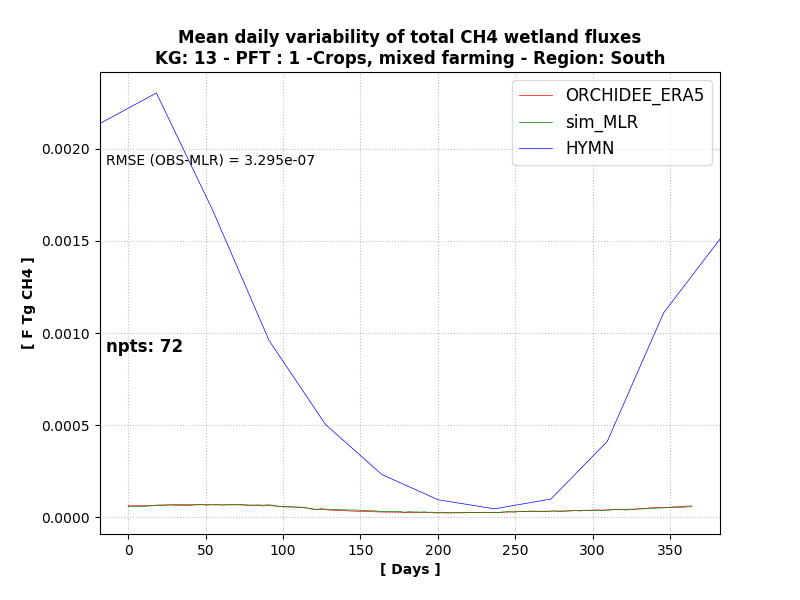
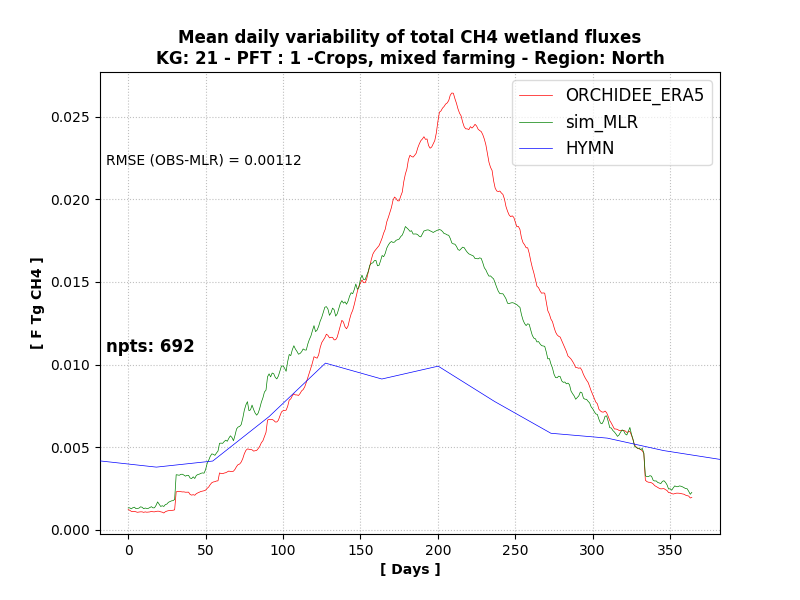
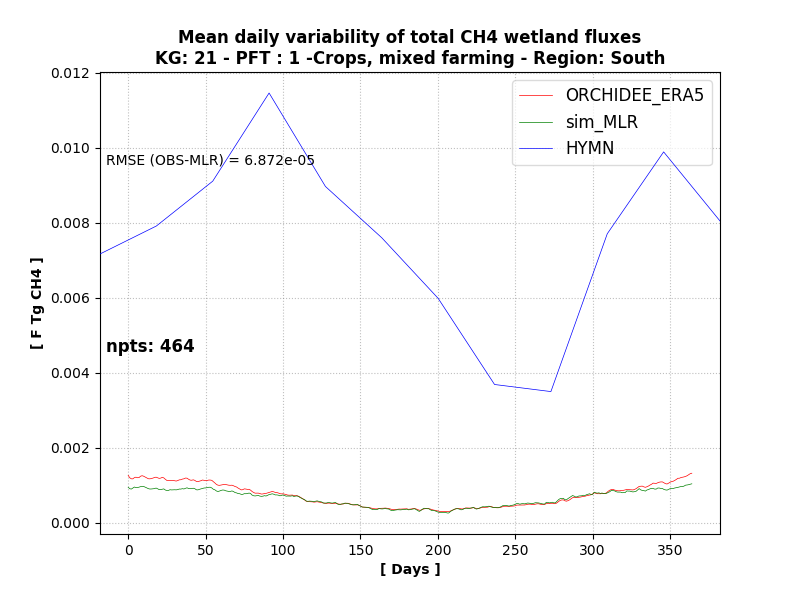
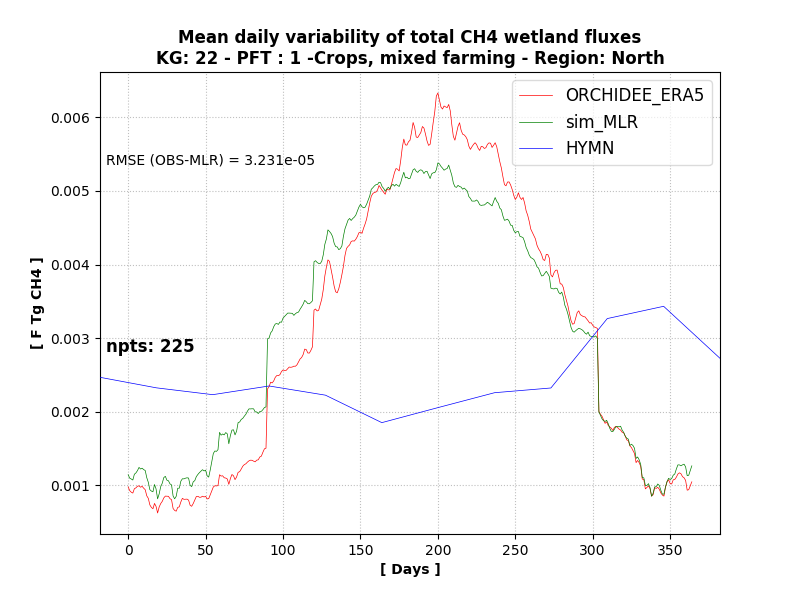
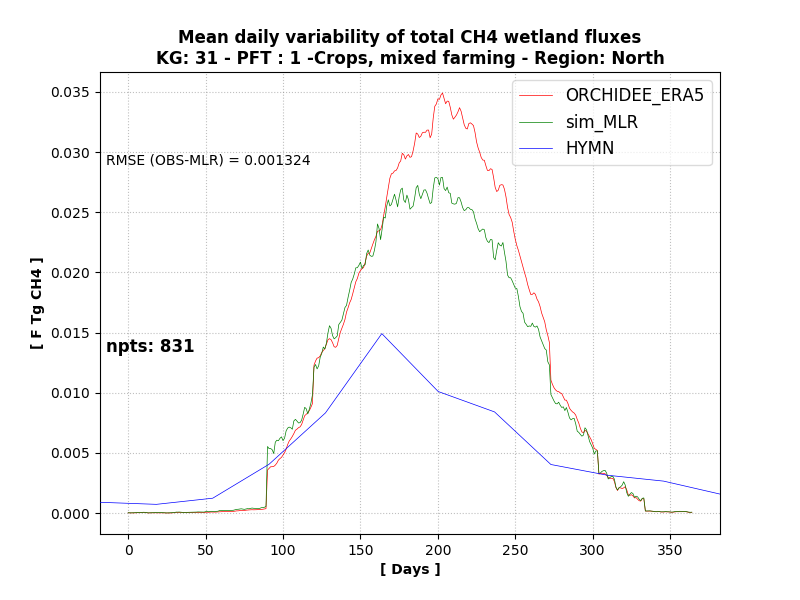
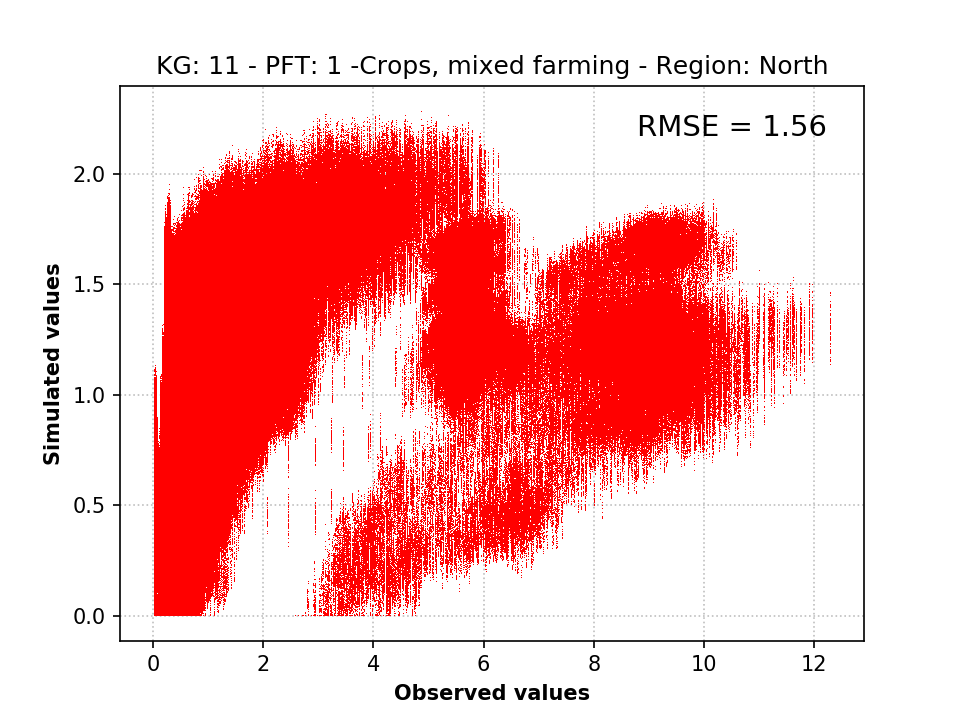
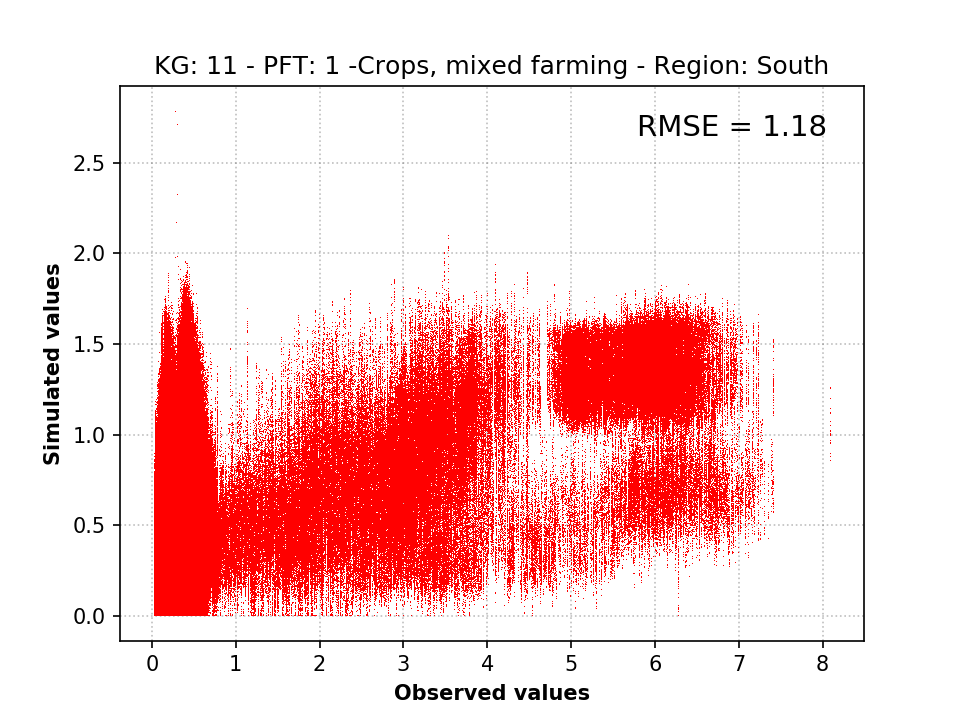
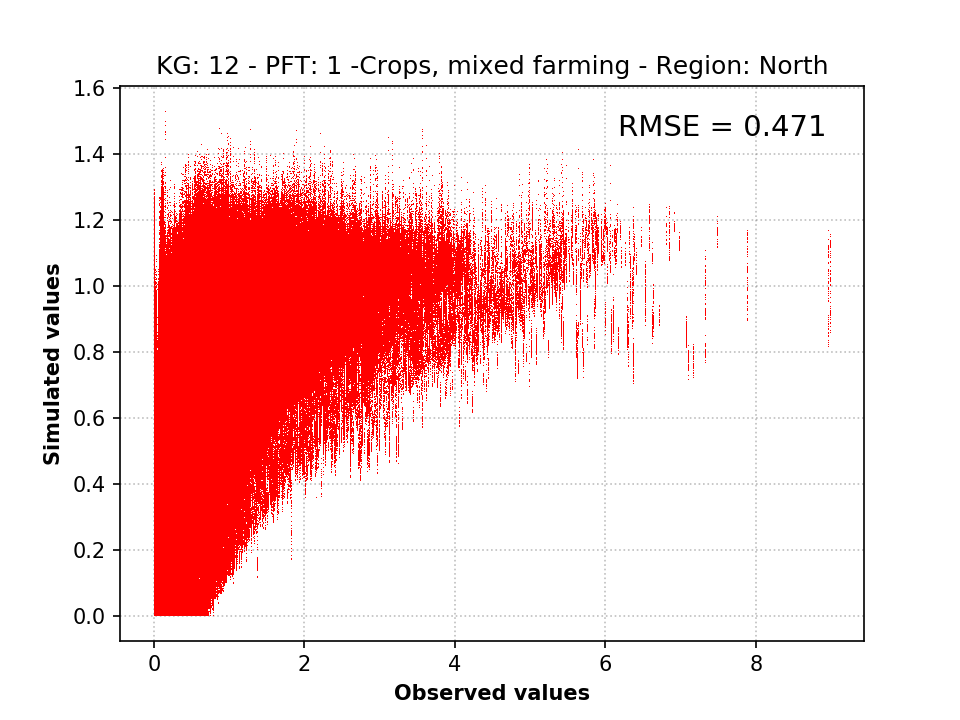
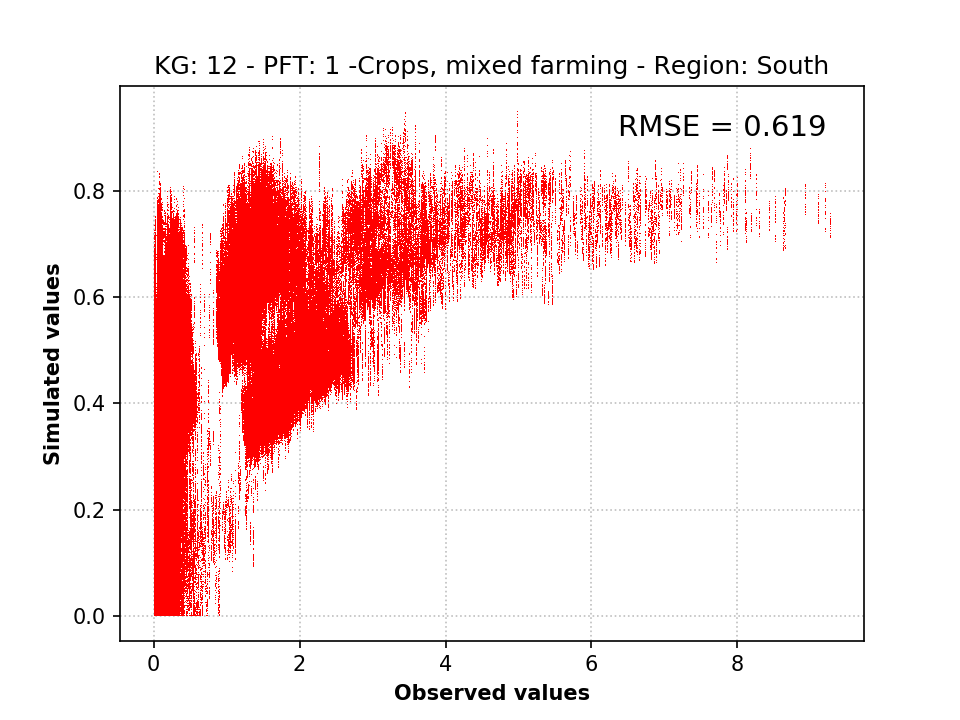
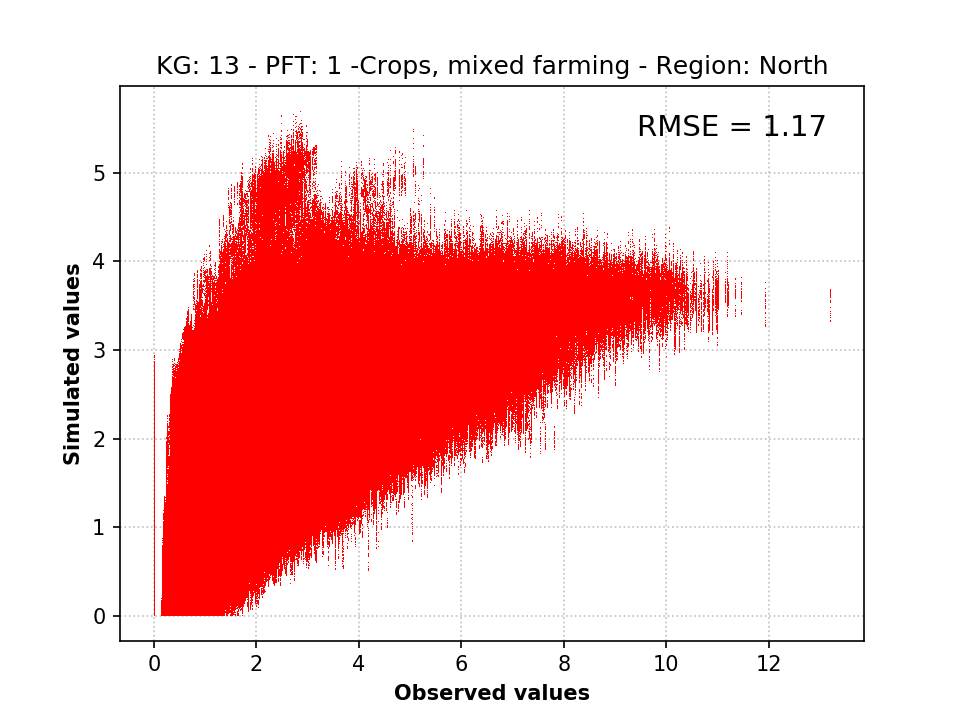
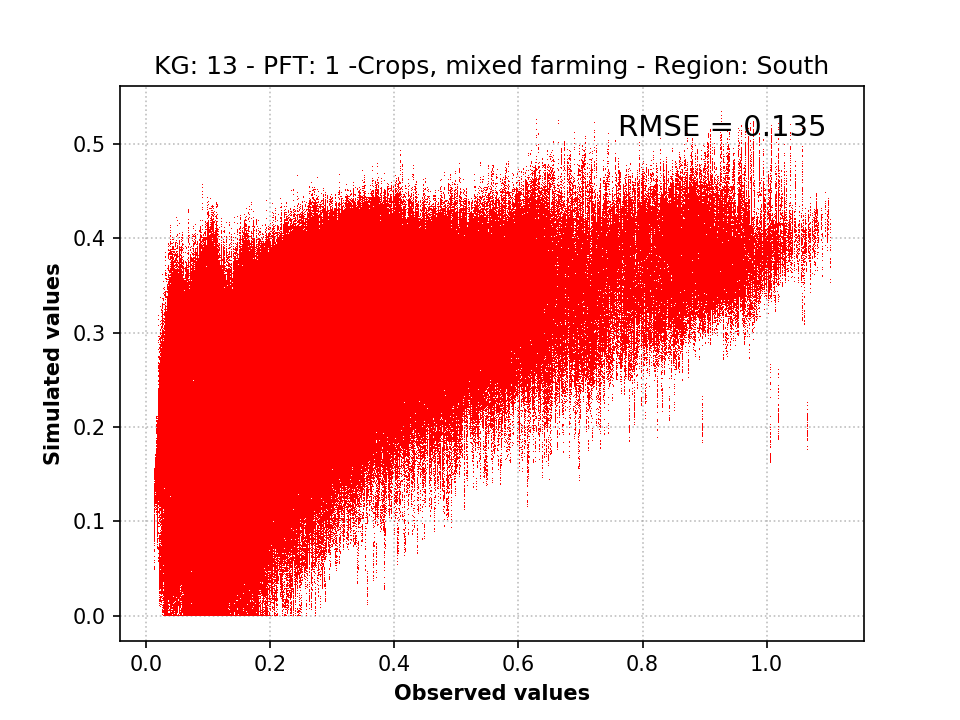
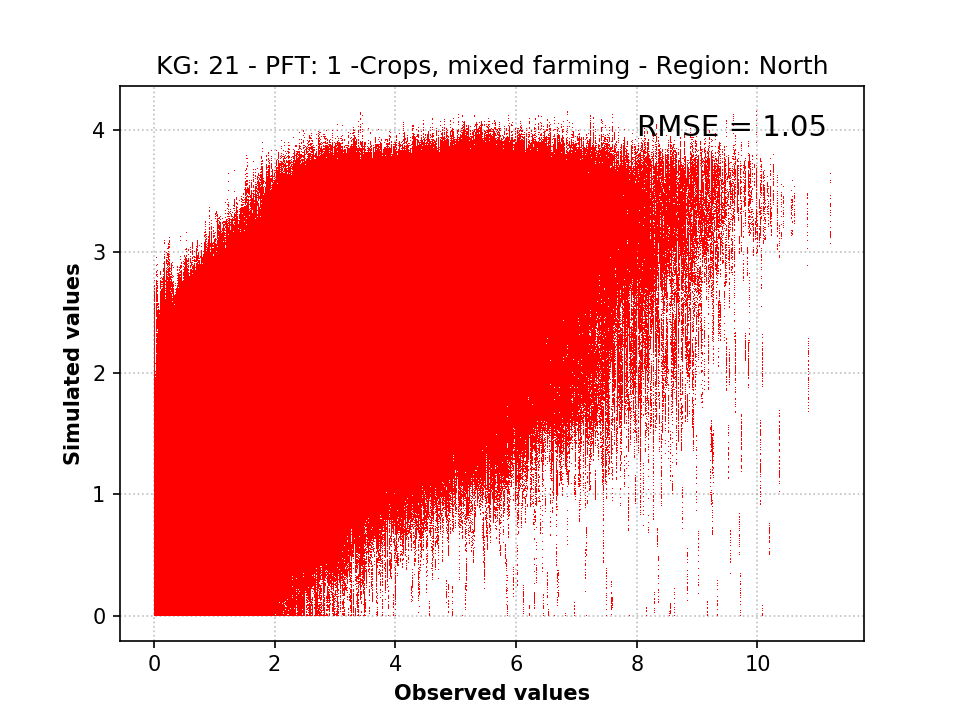
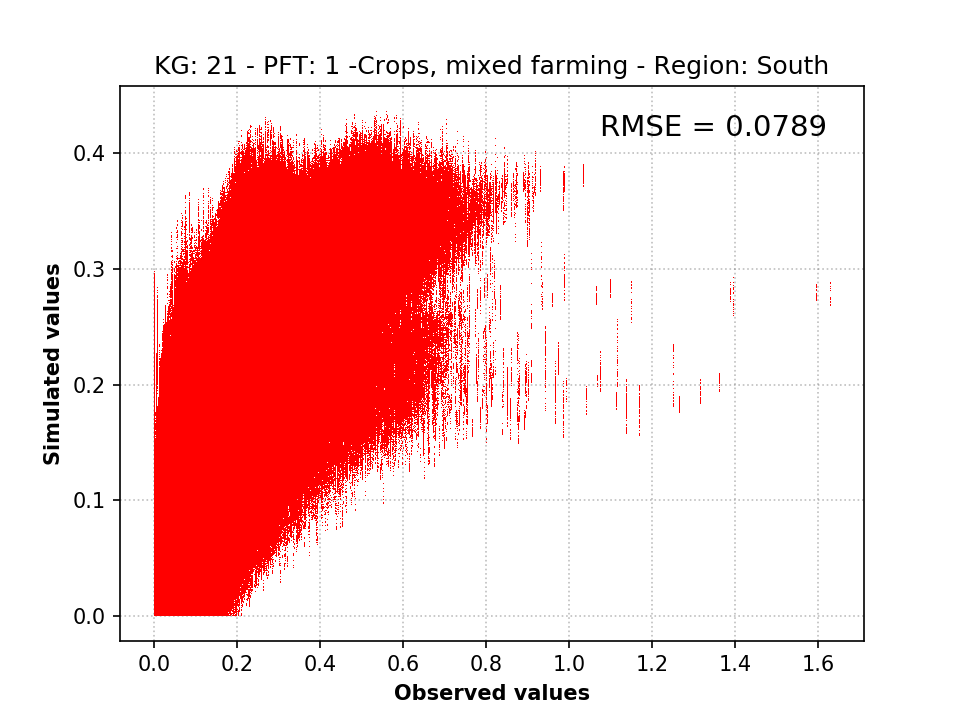
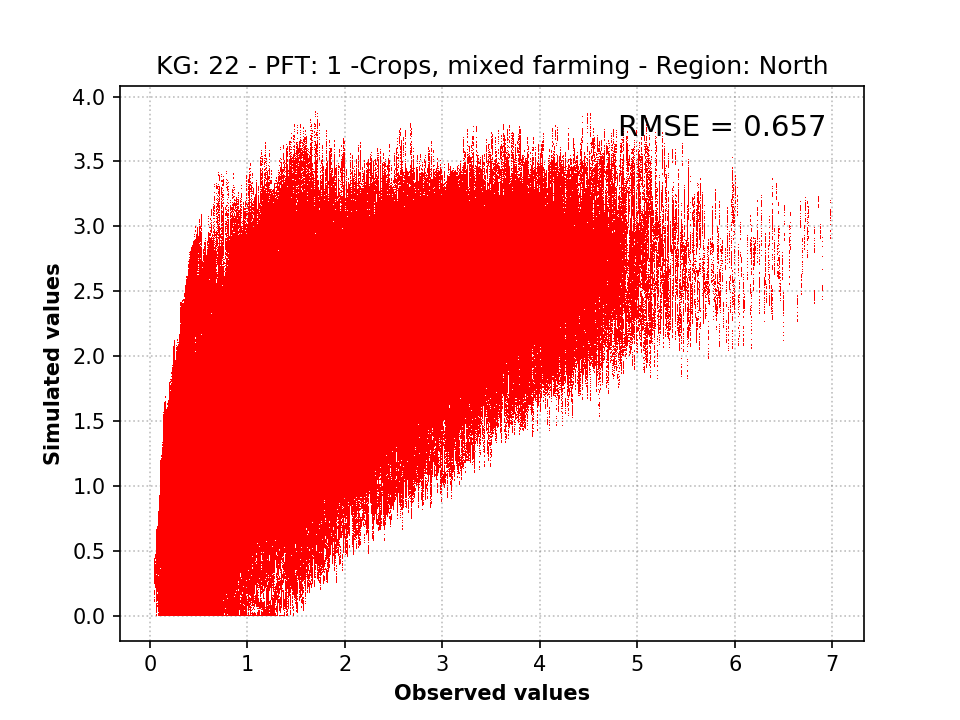
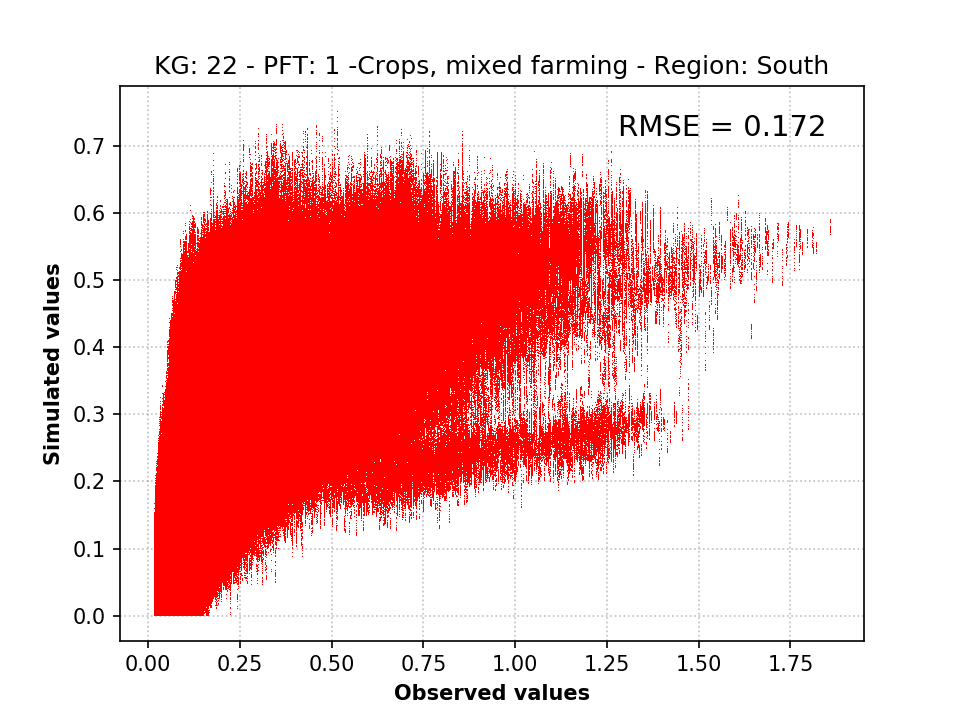
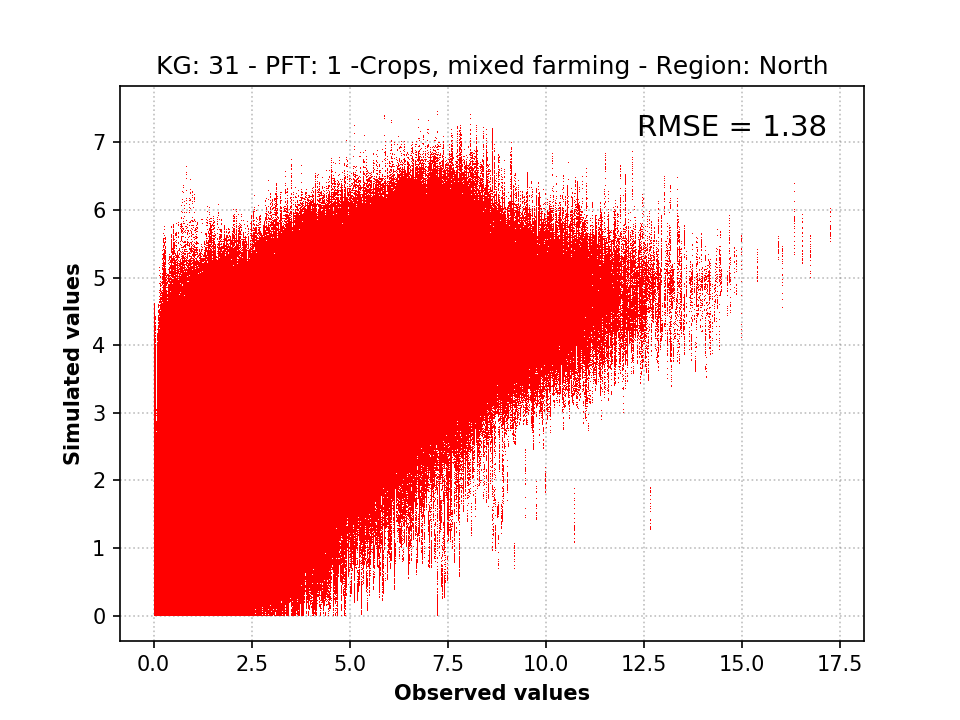
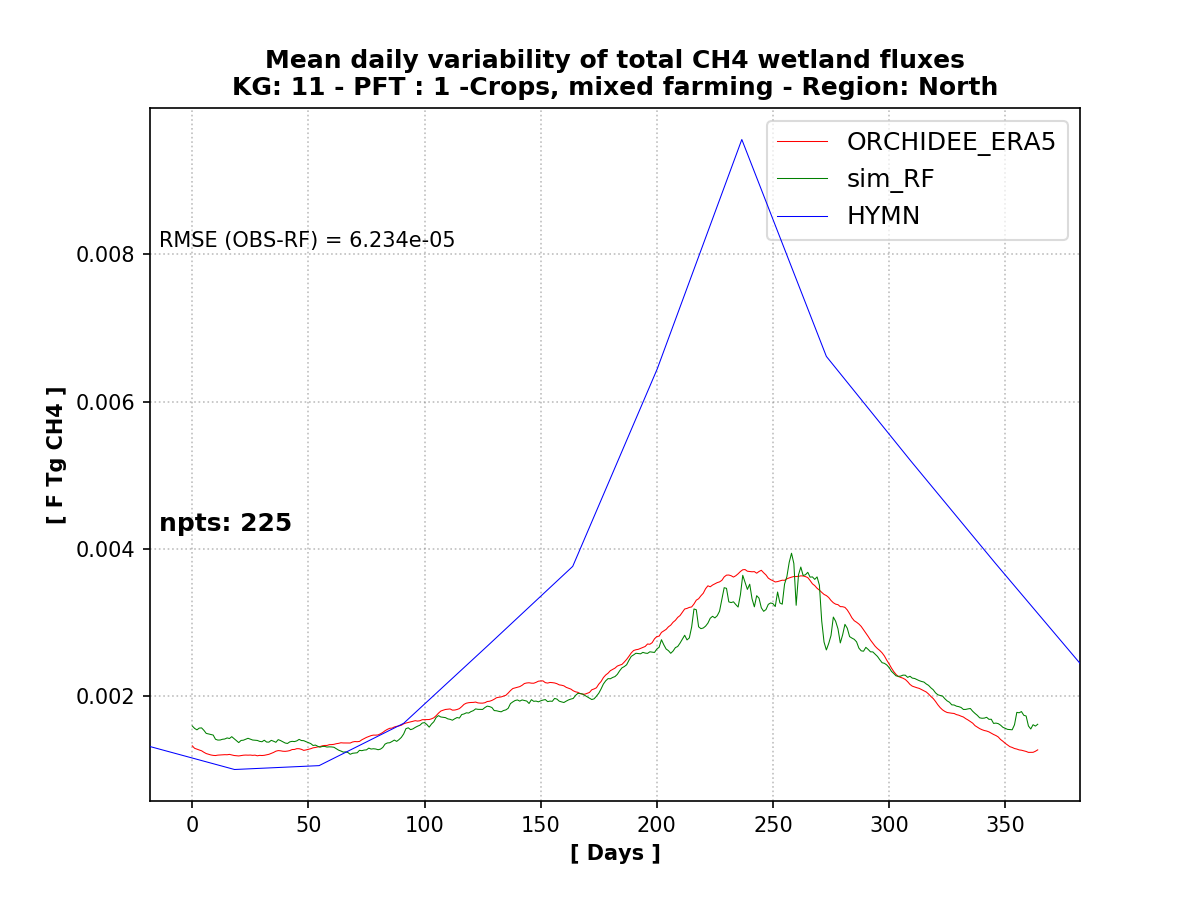
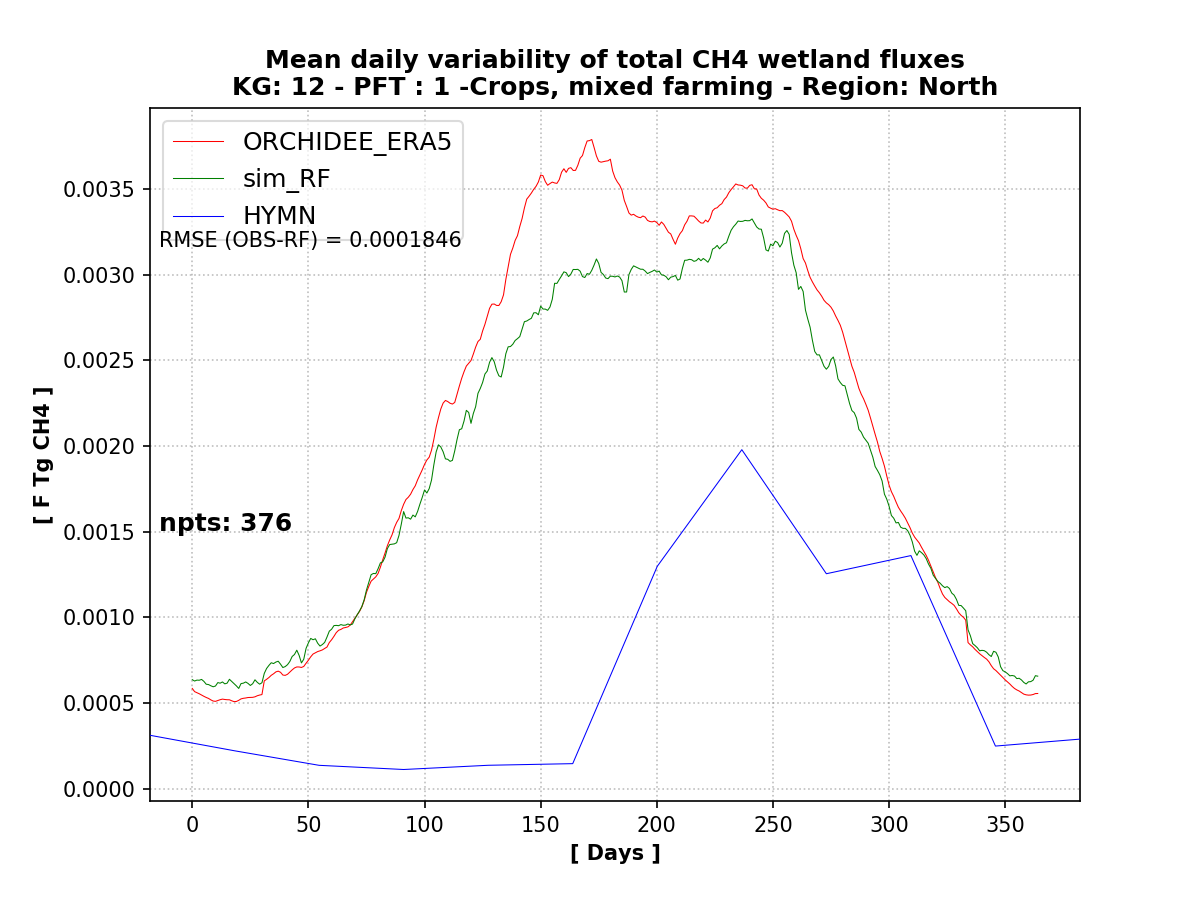
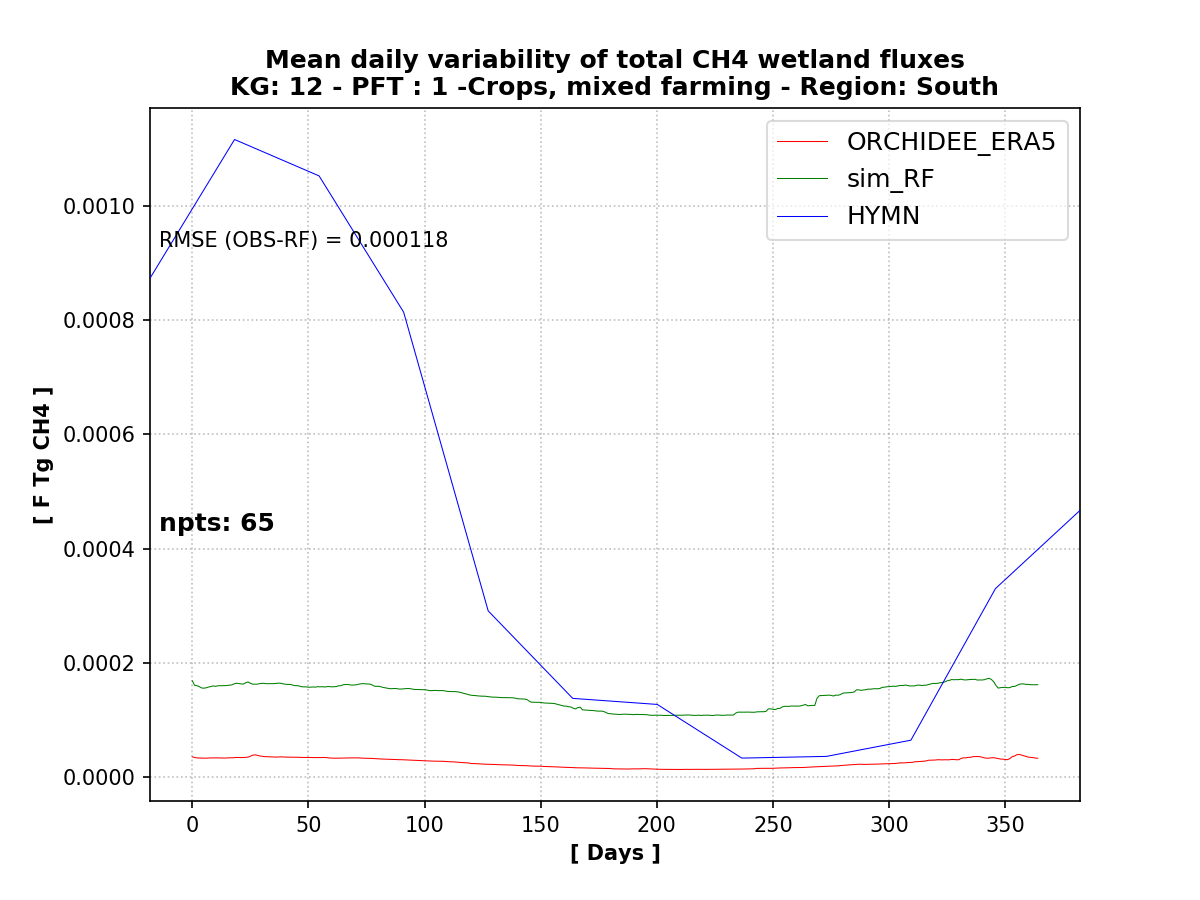
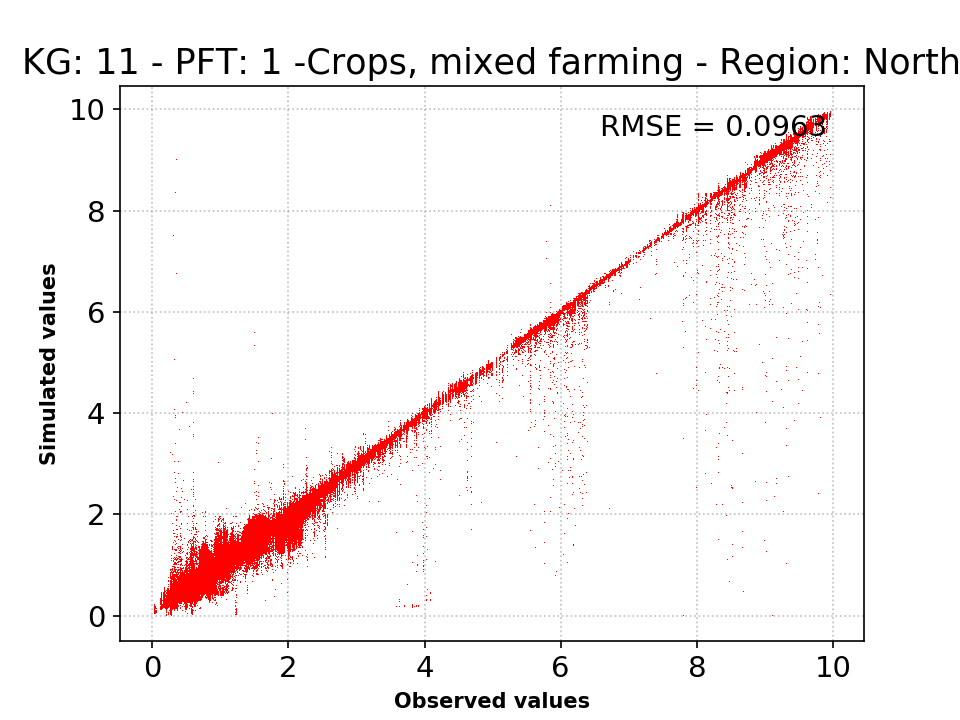
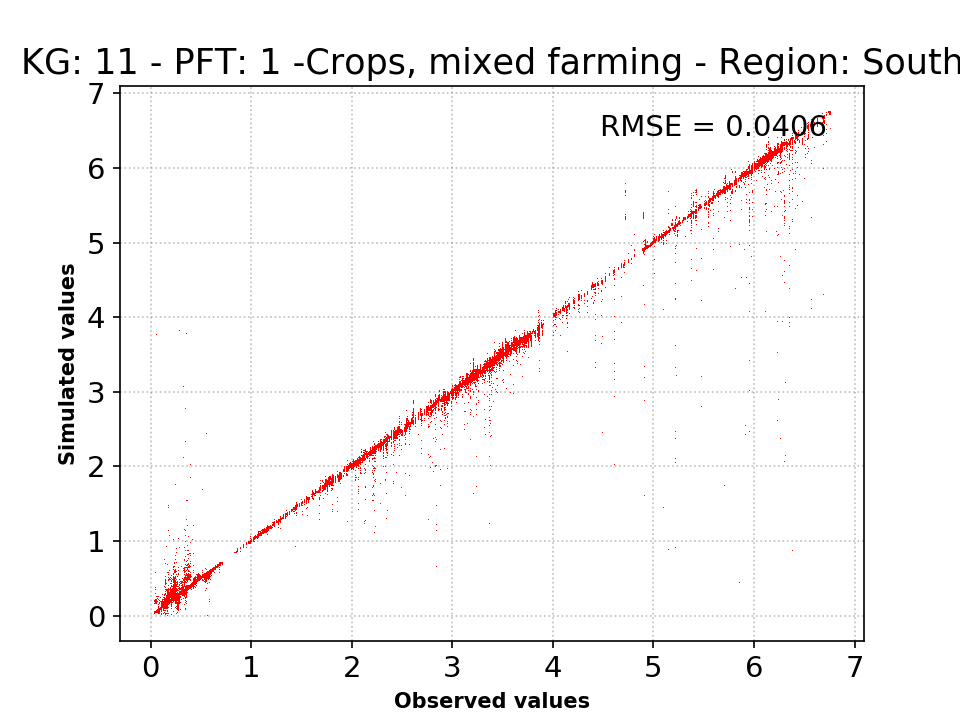
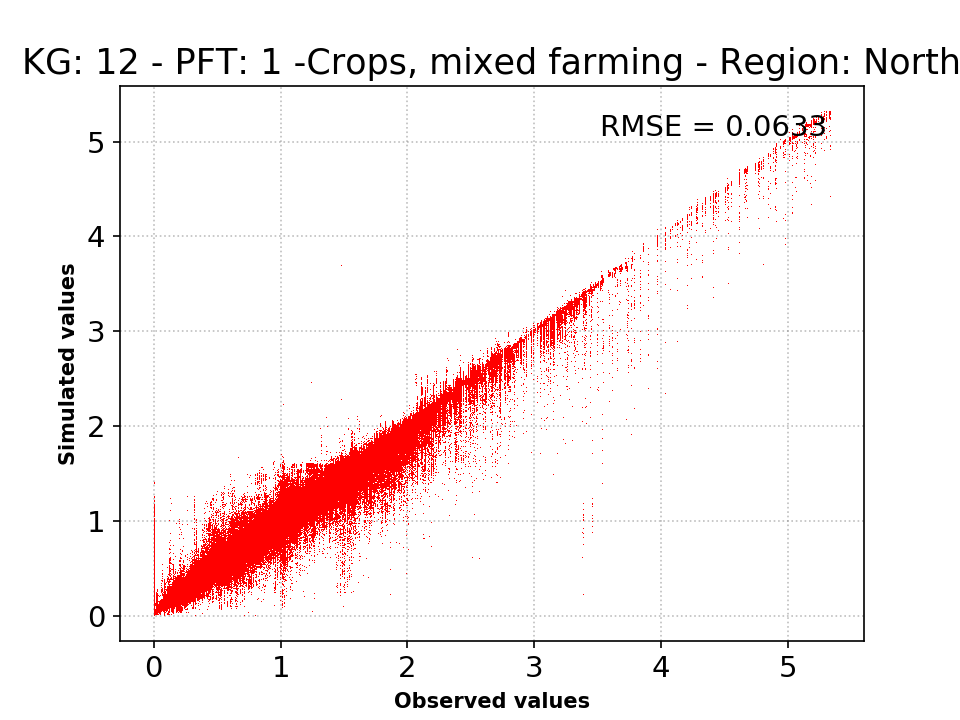
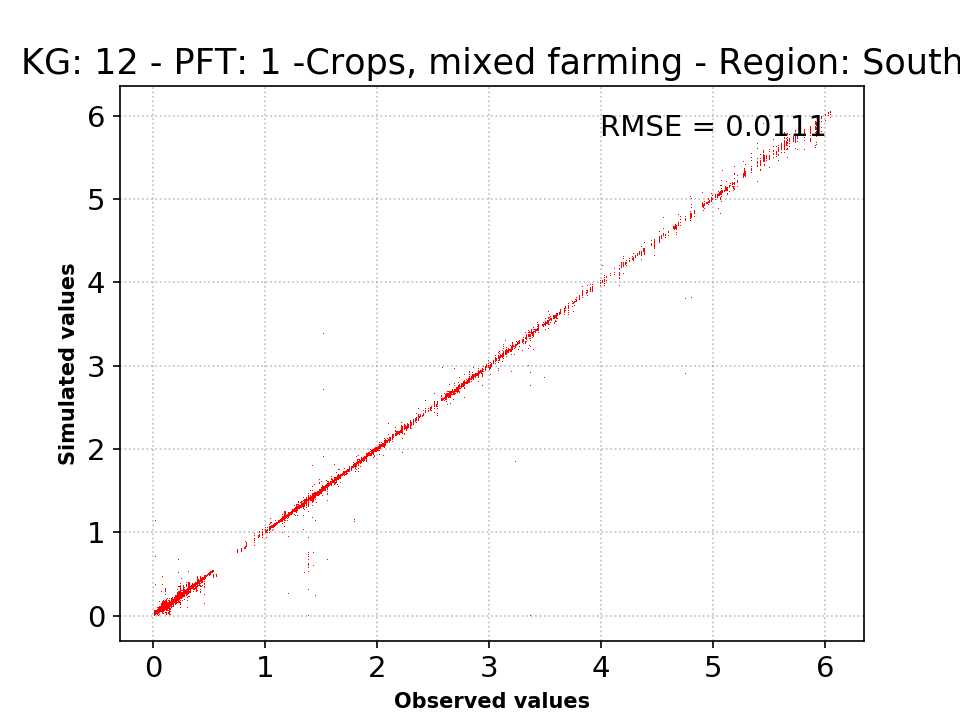
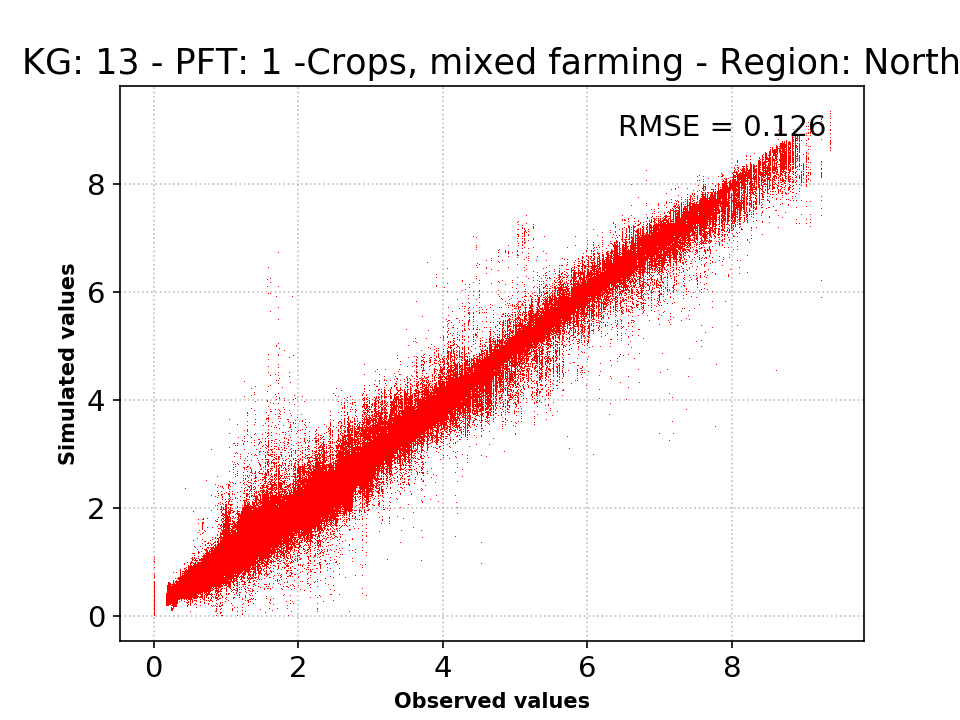
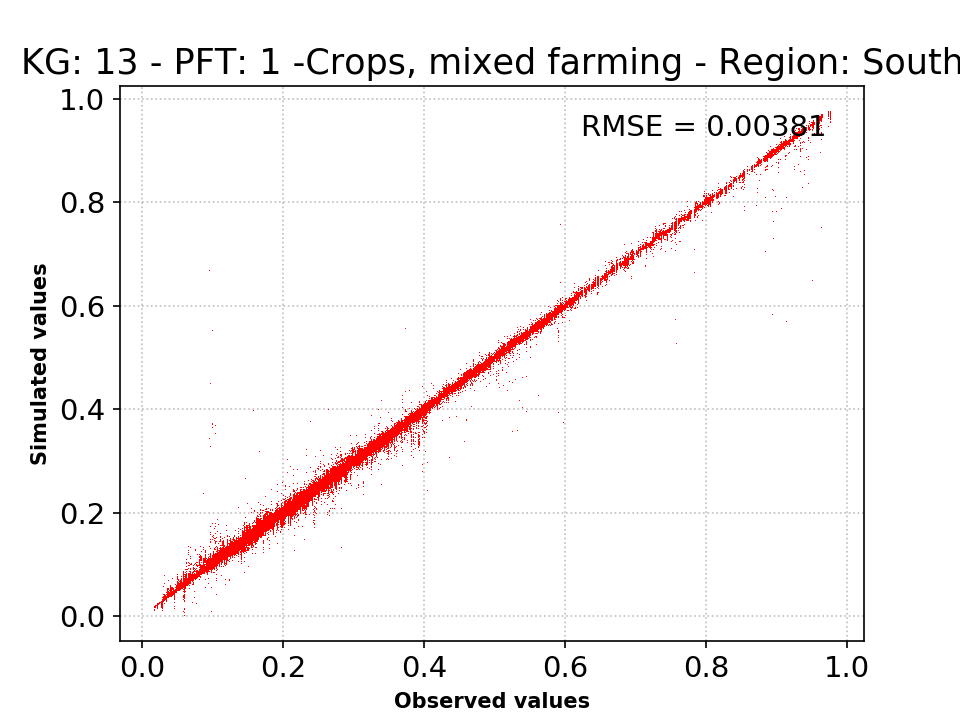
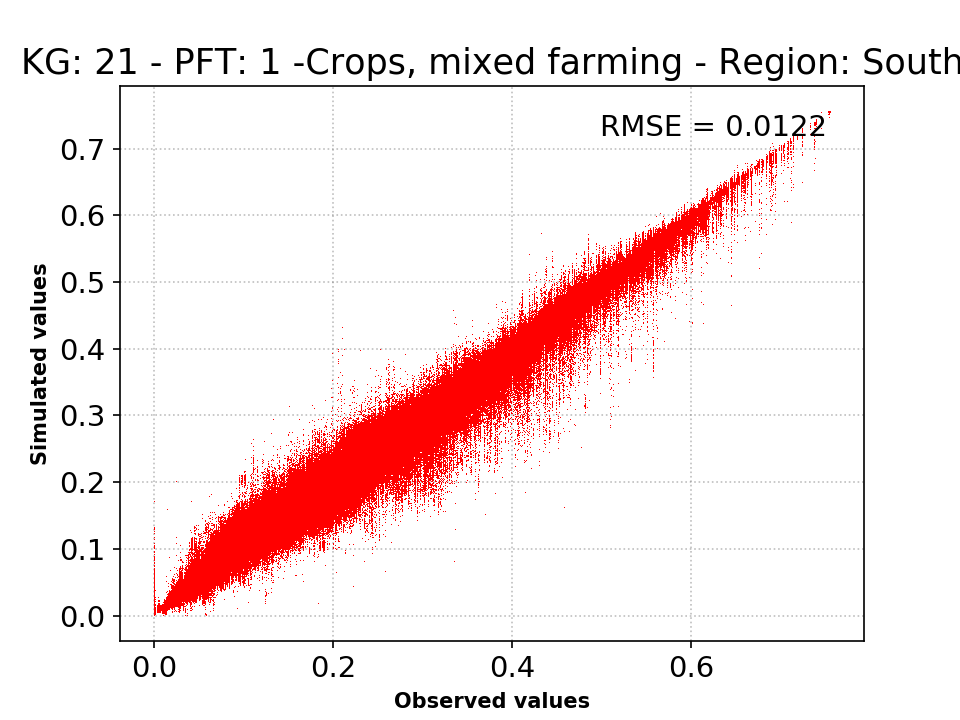
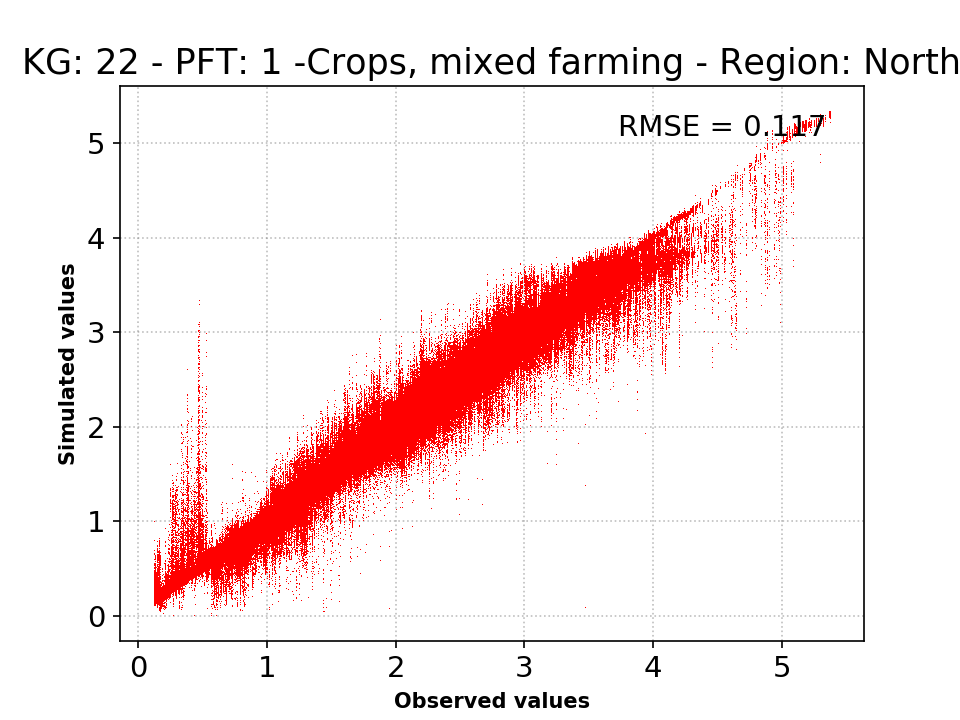
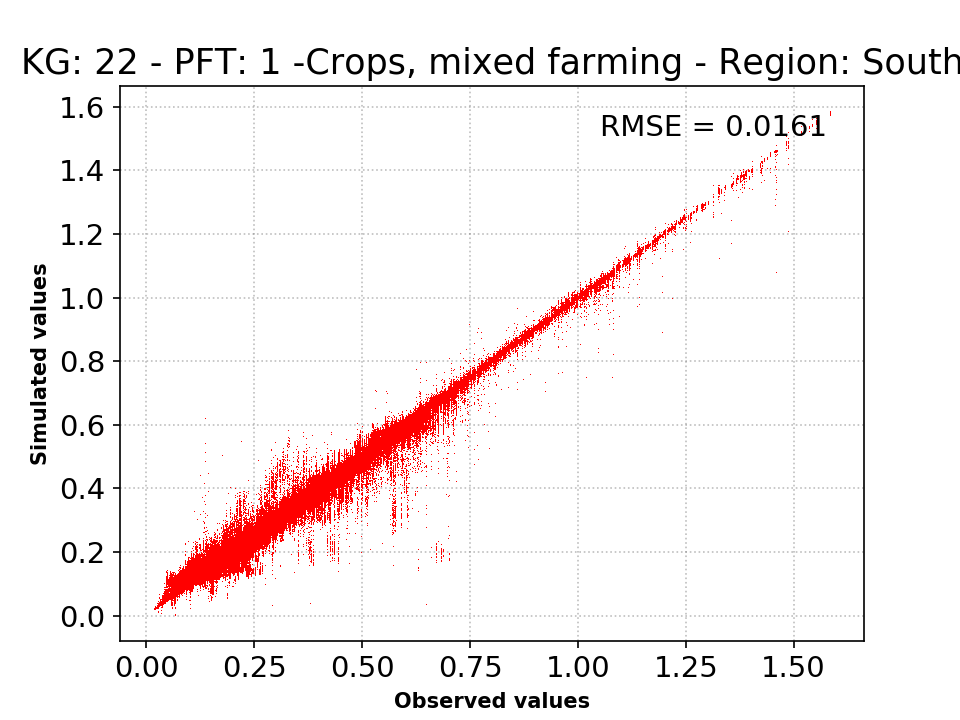
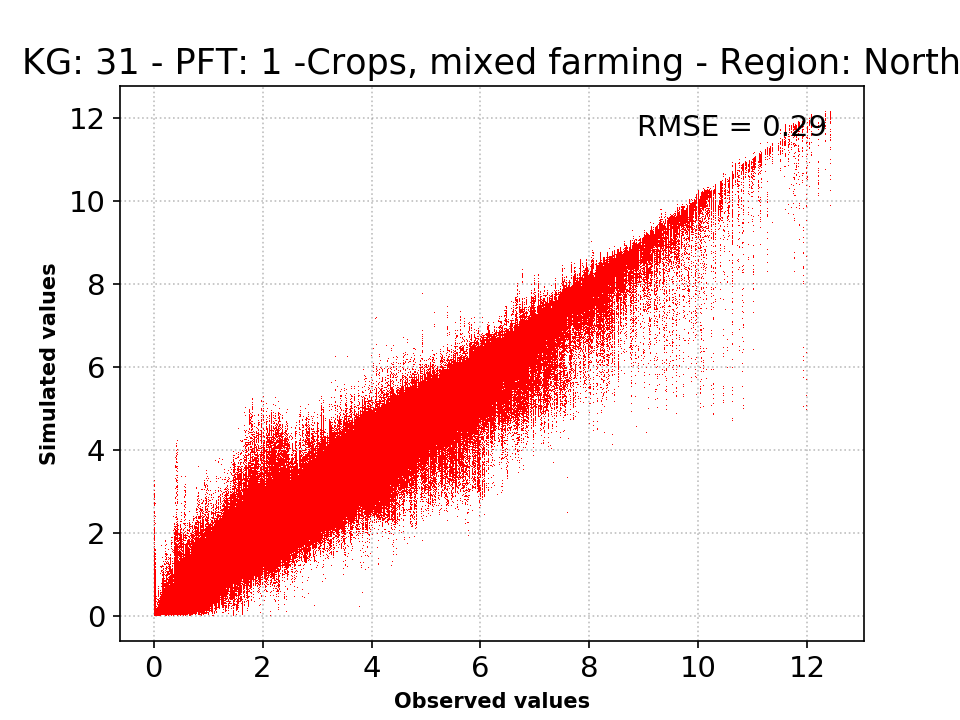
- Section 3 : CH4 variability per PFT sub-region
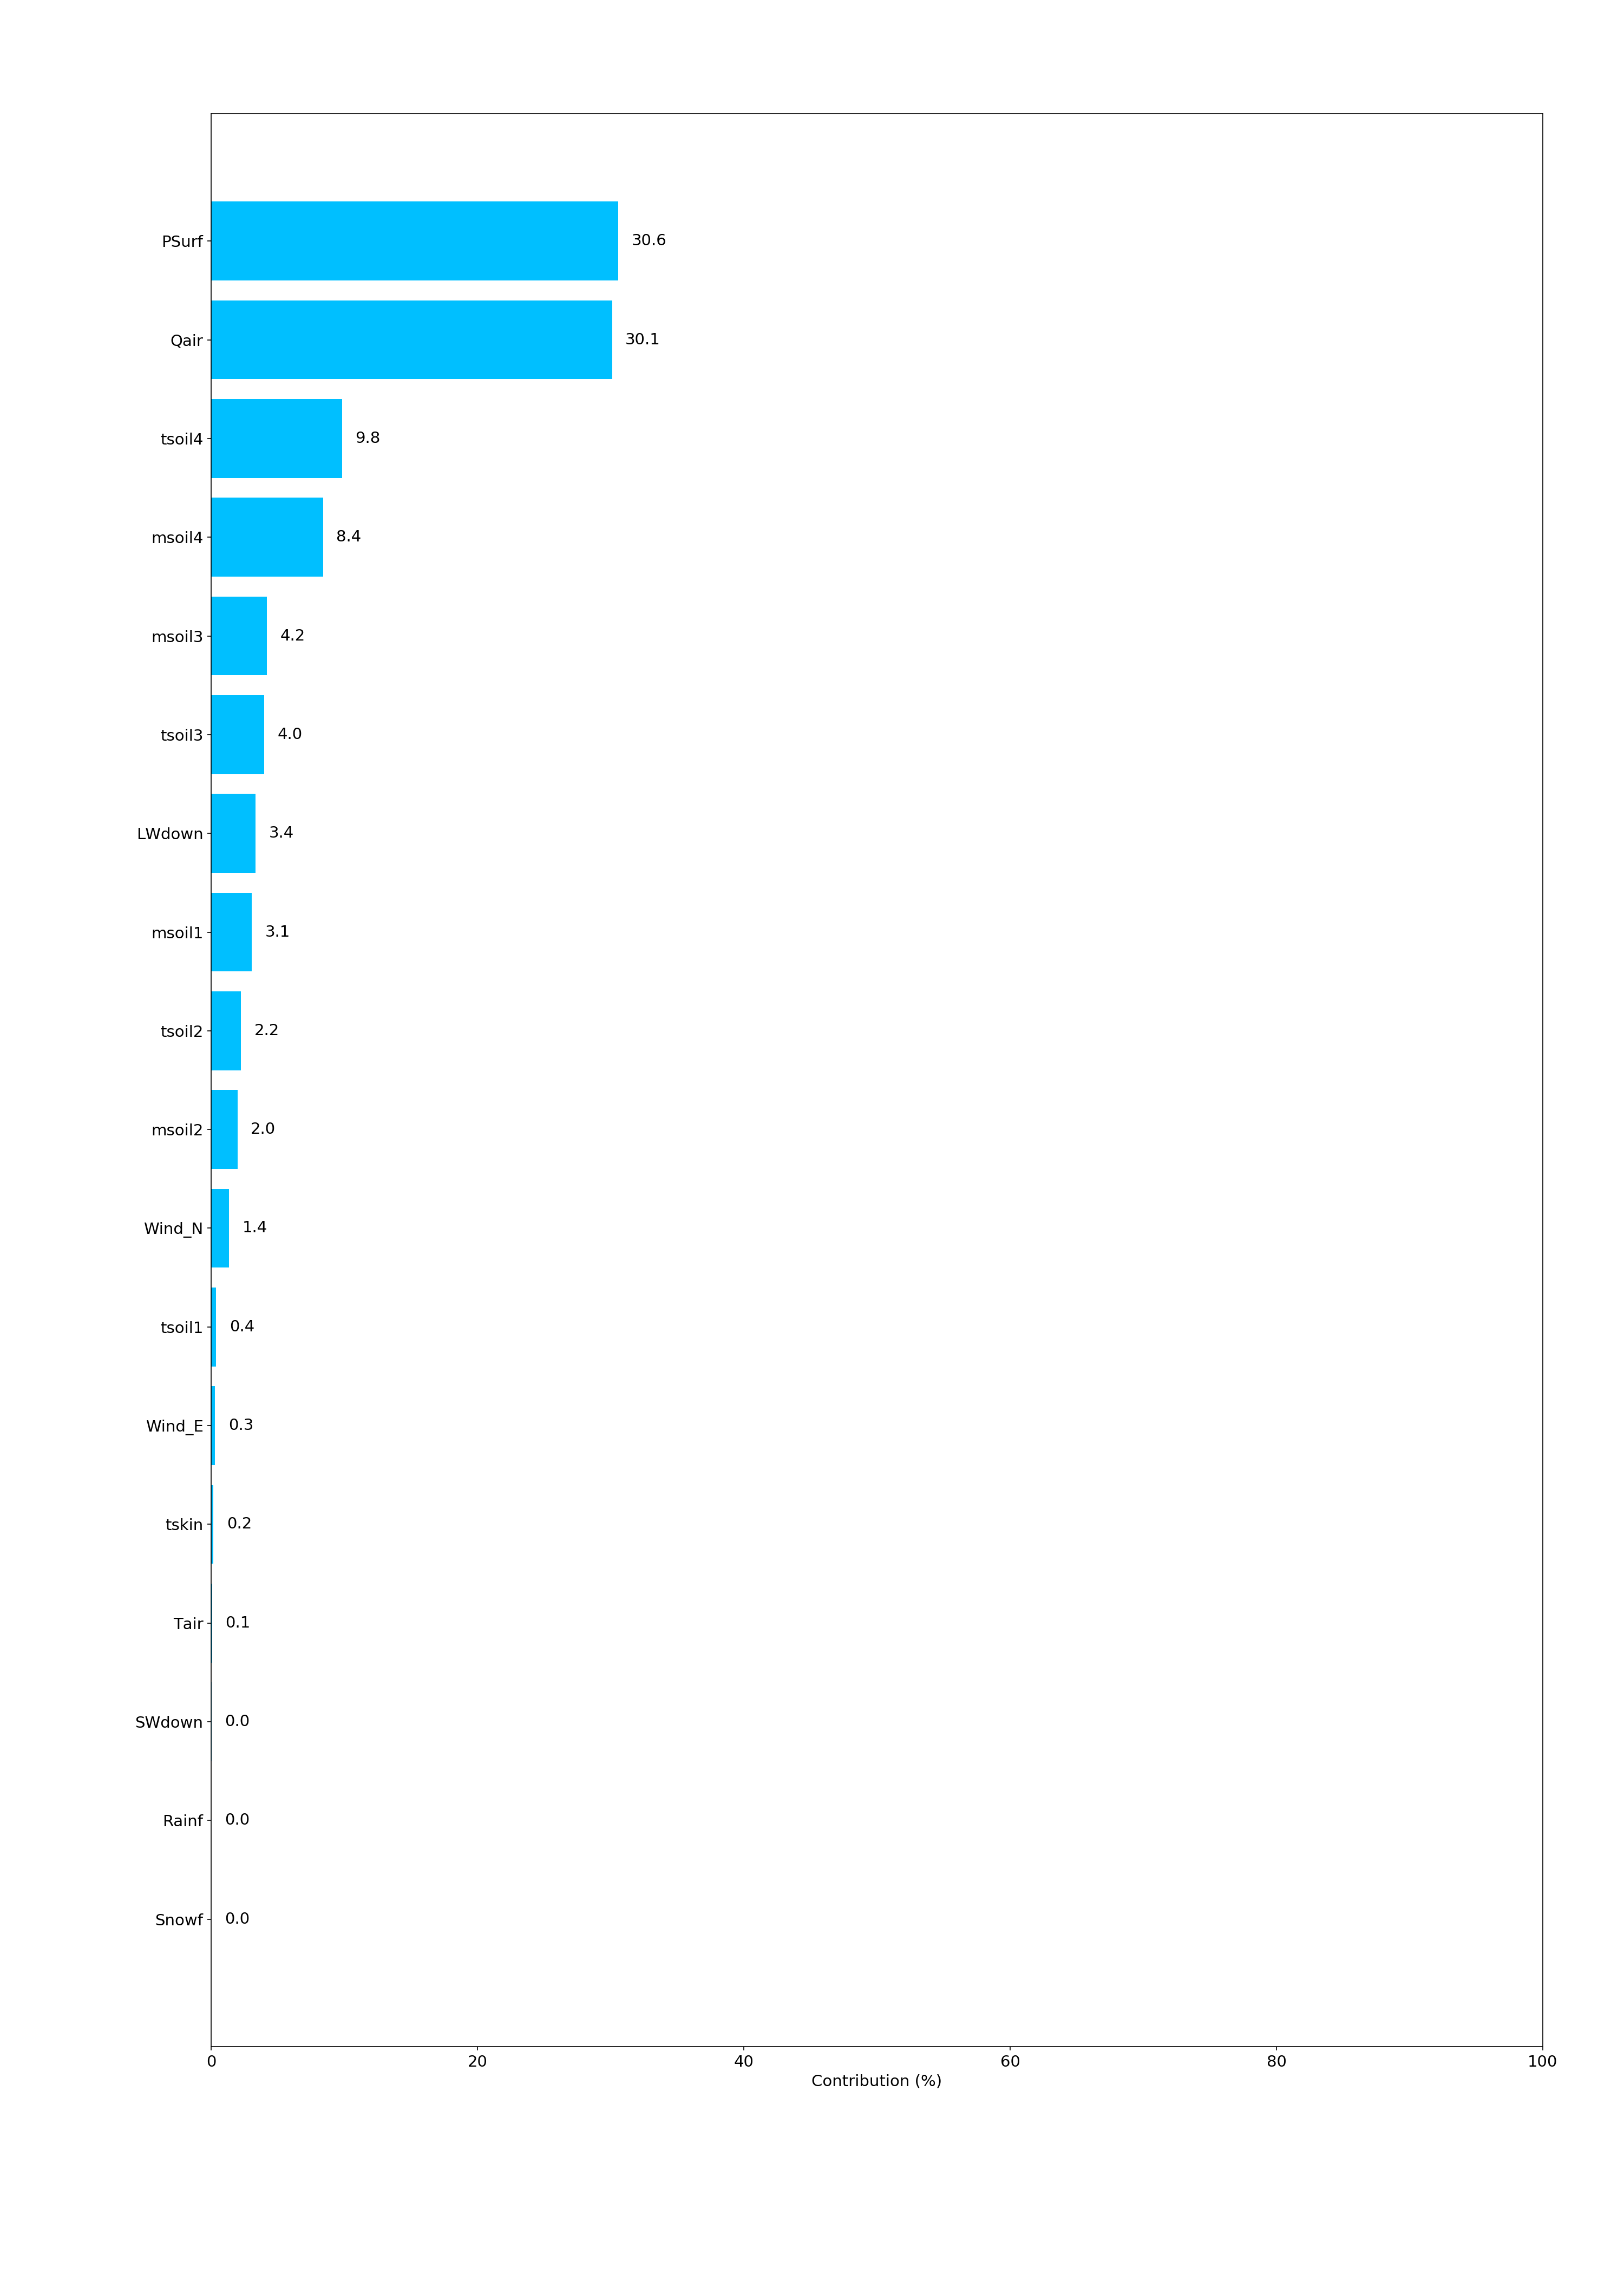
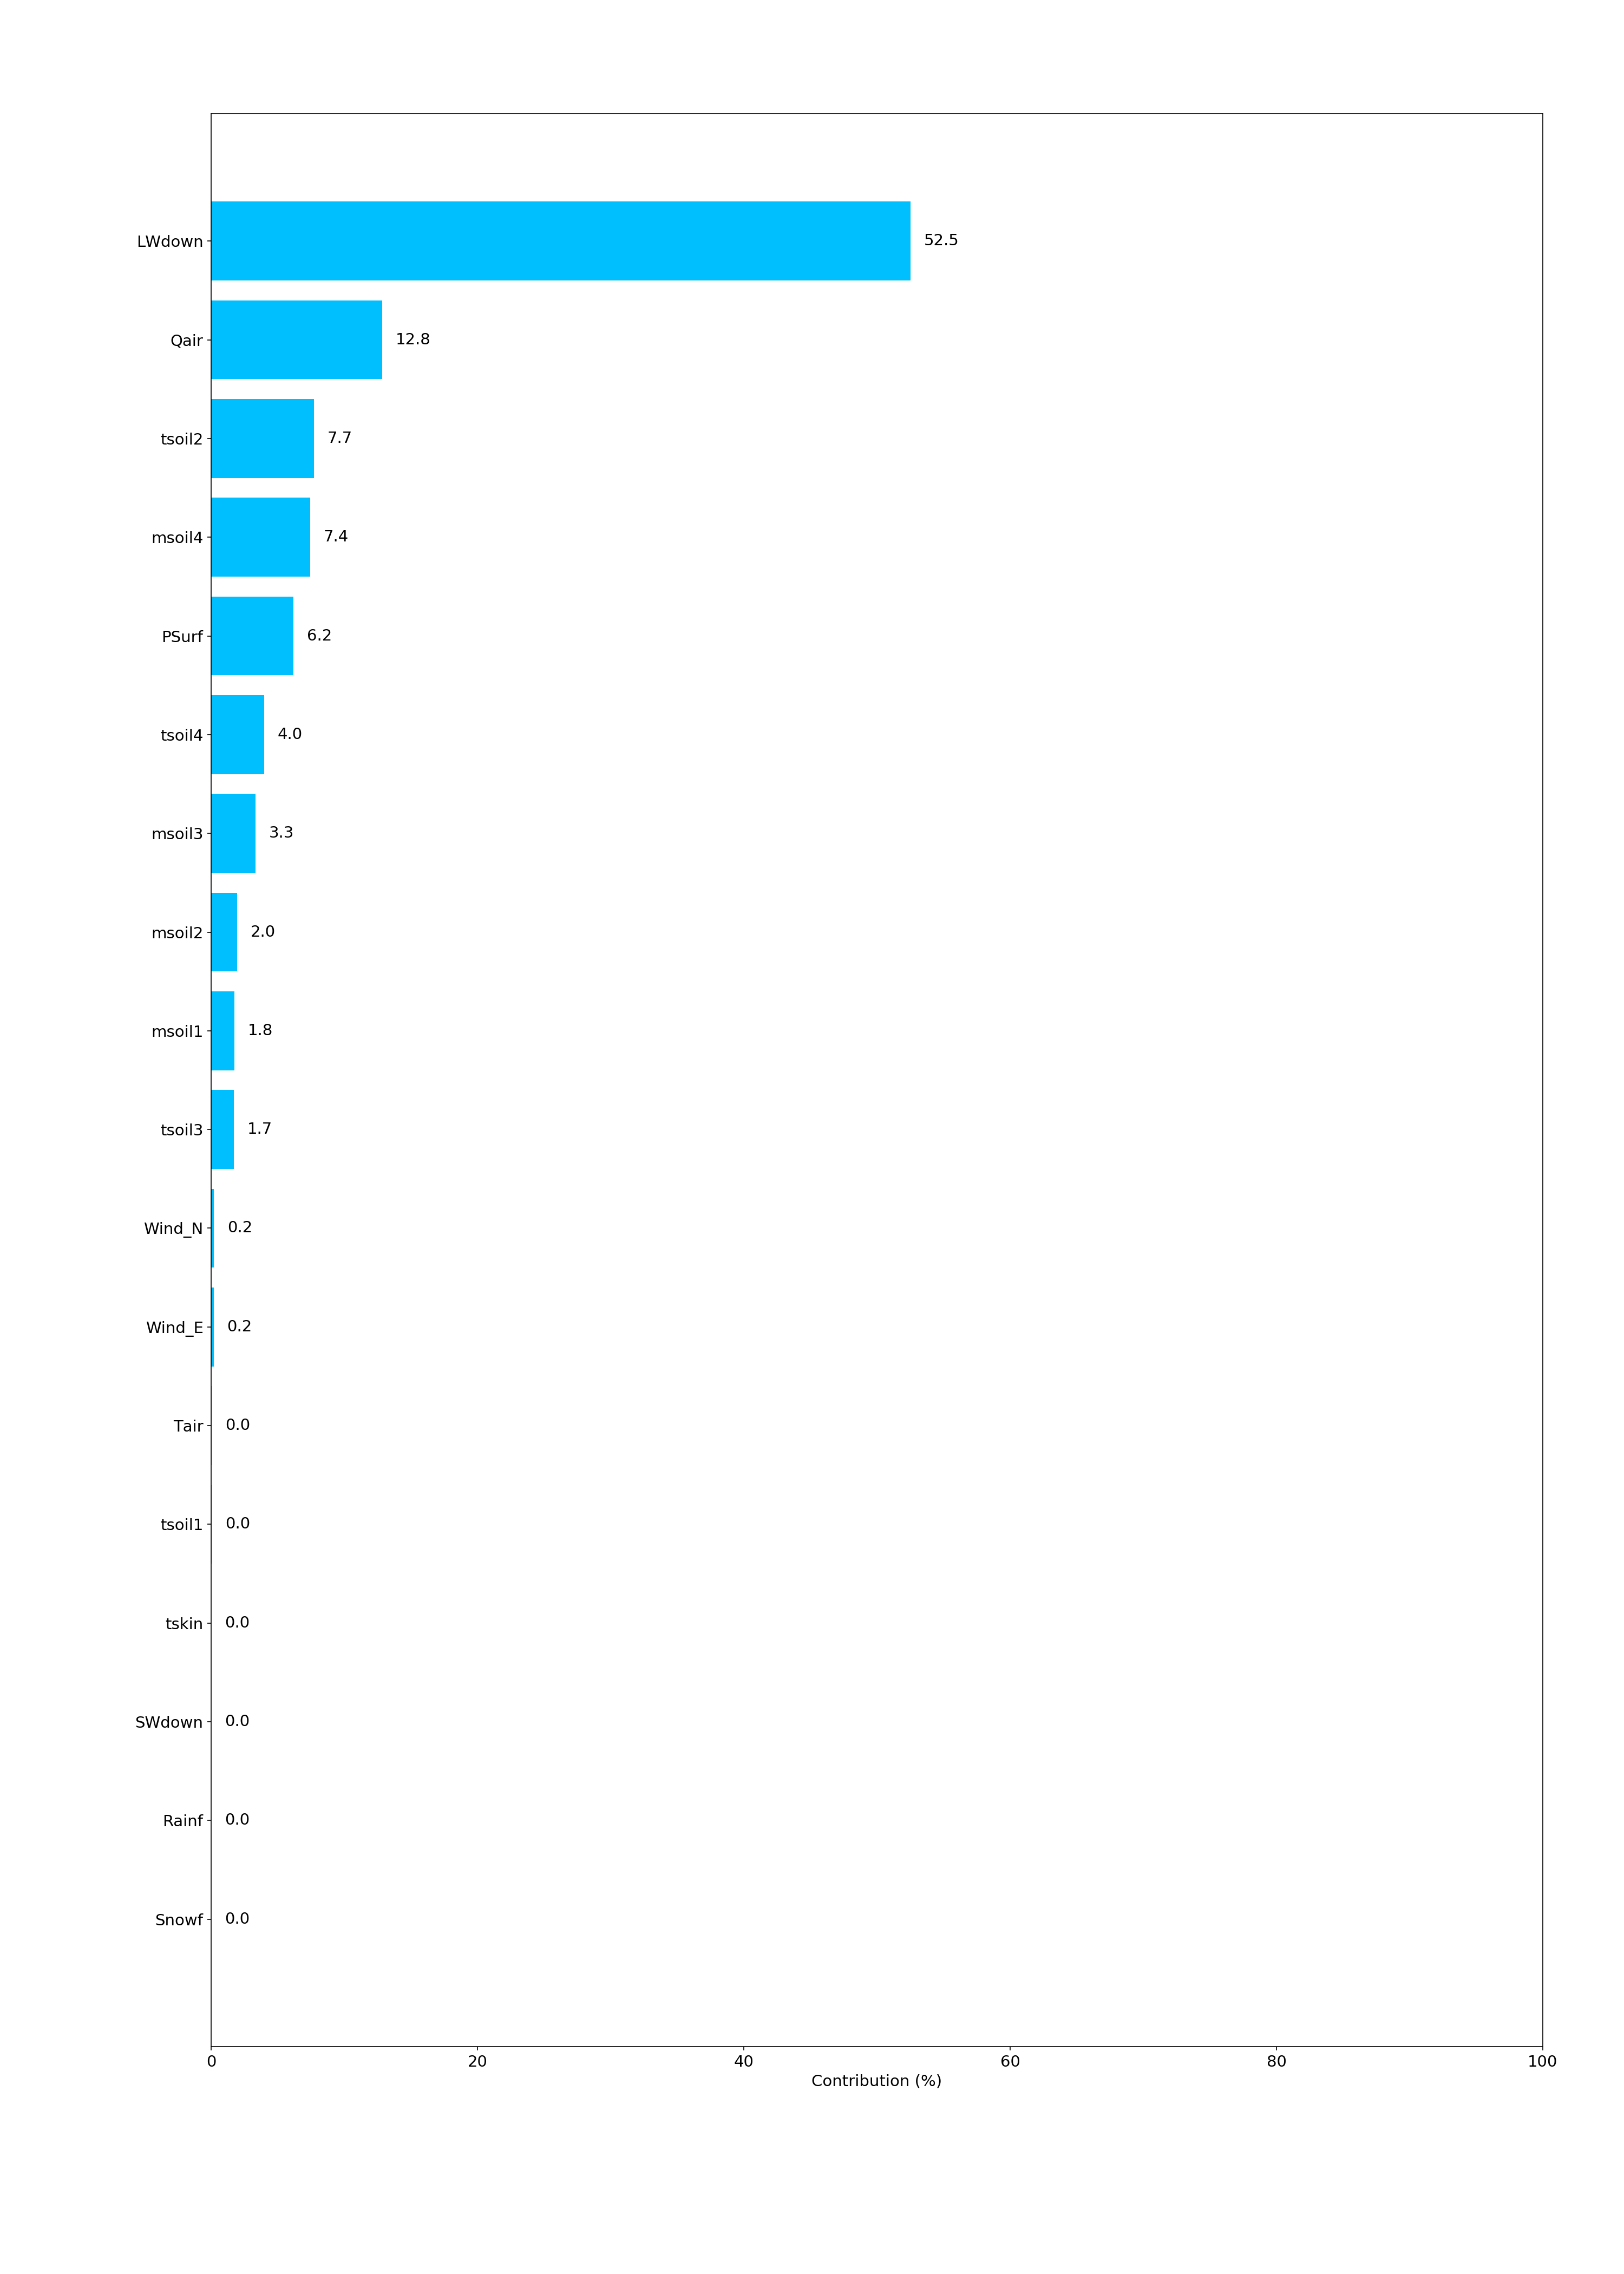
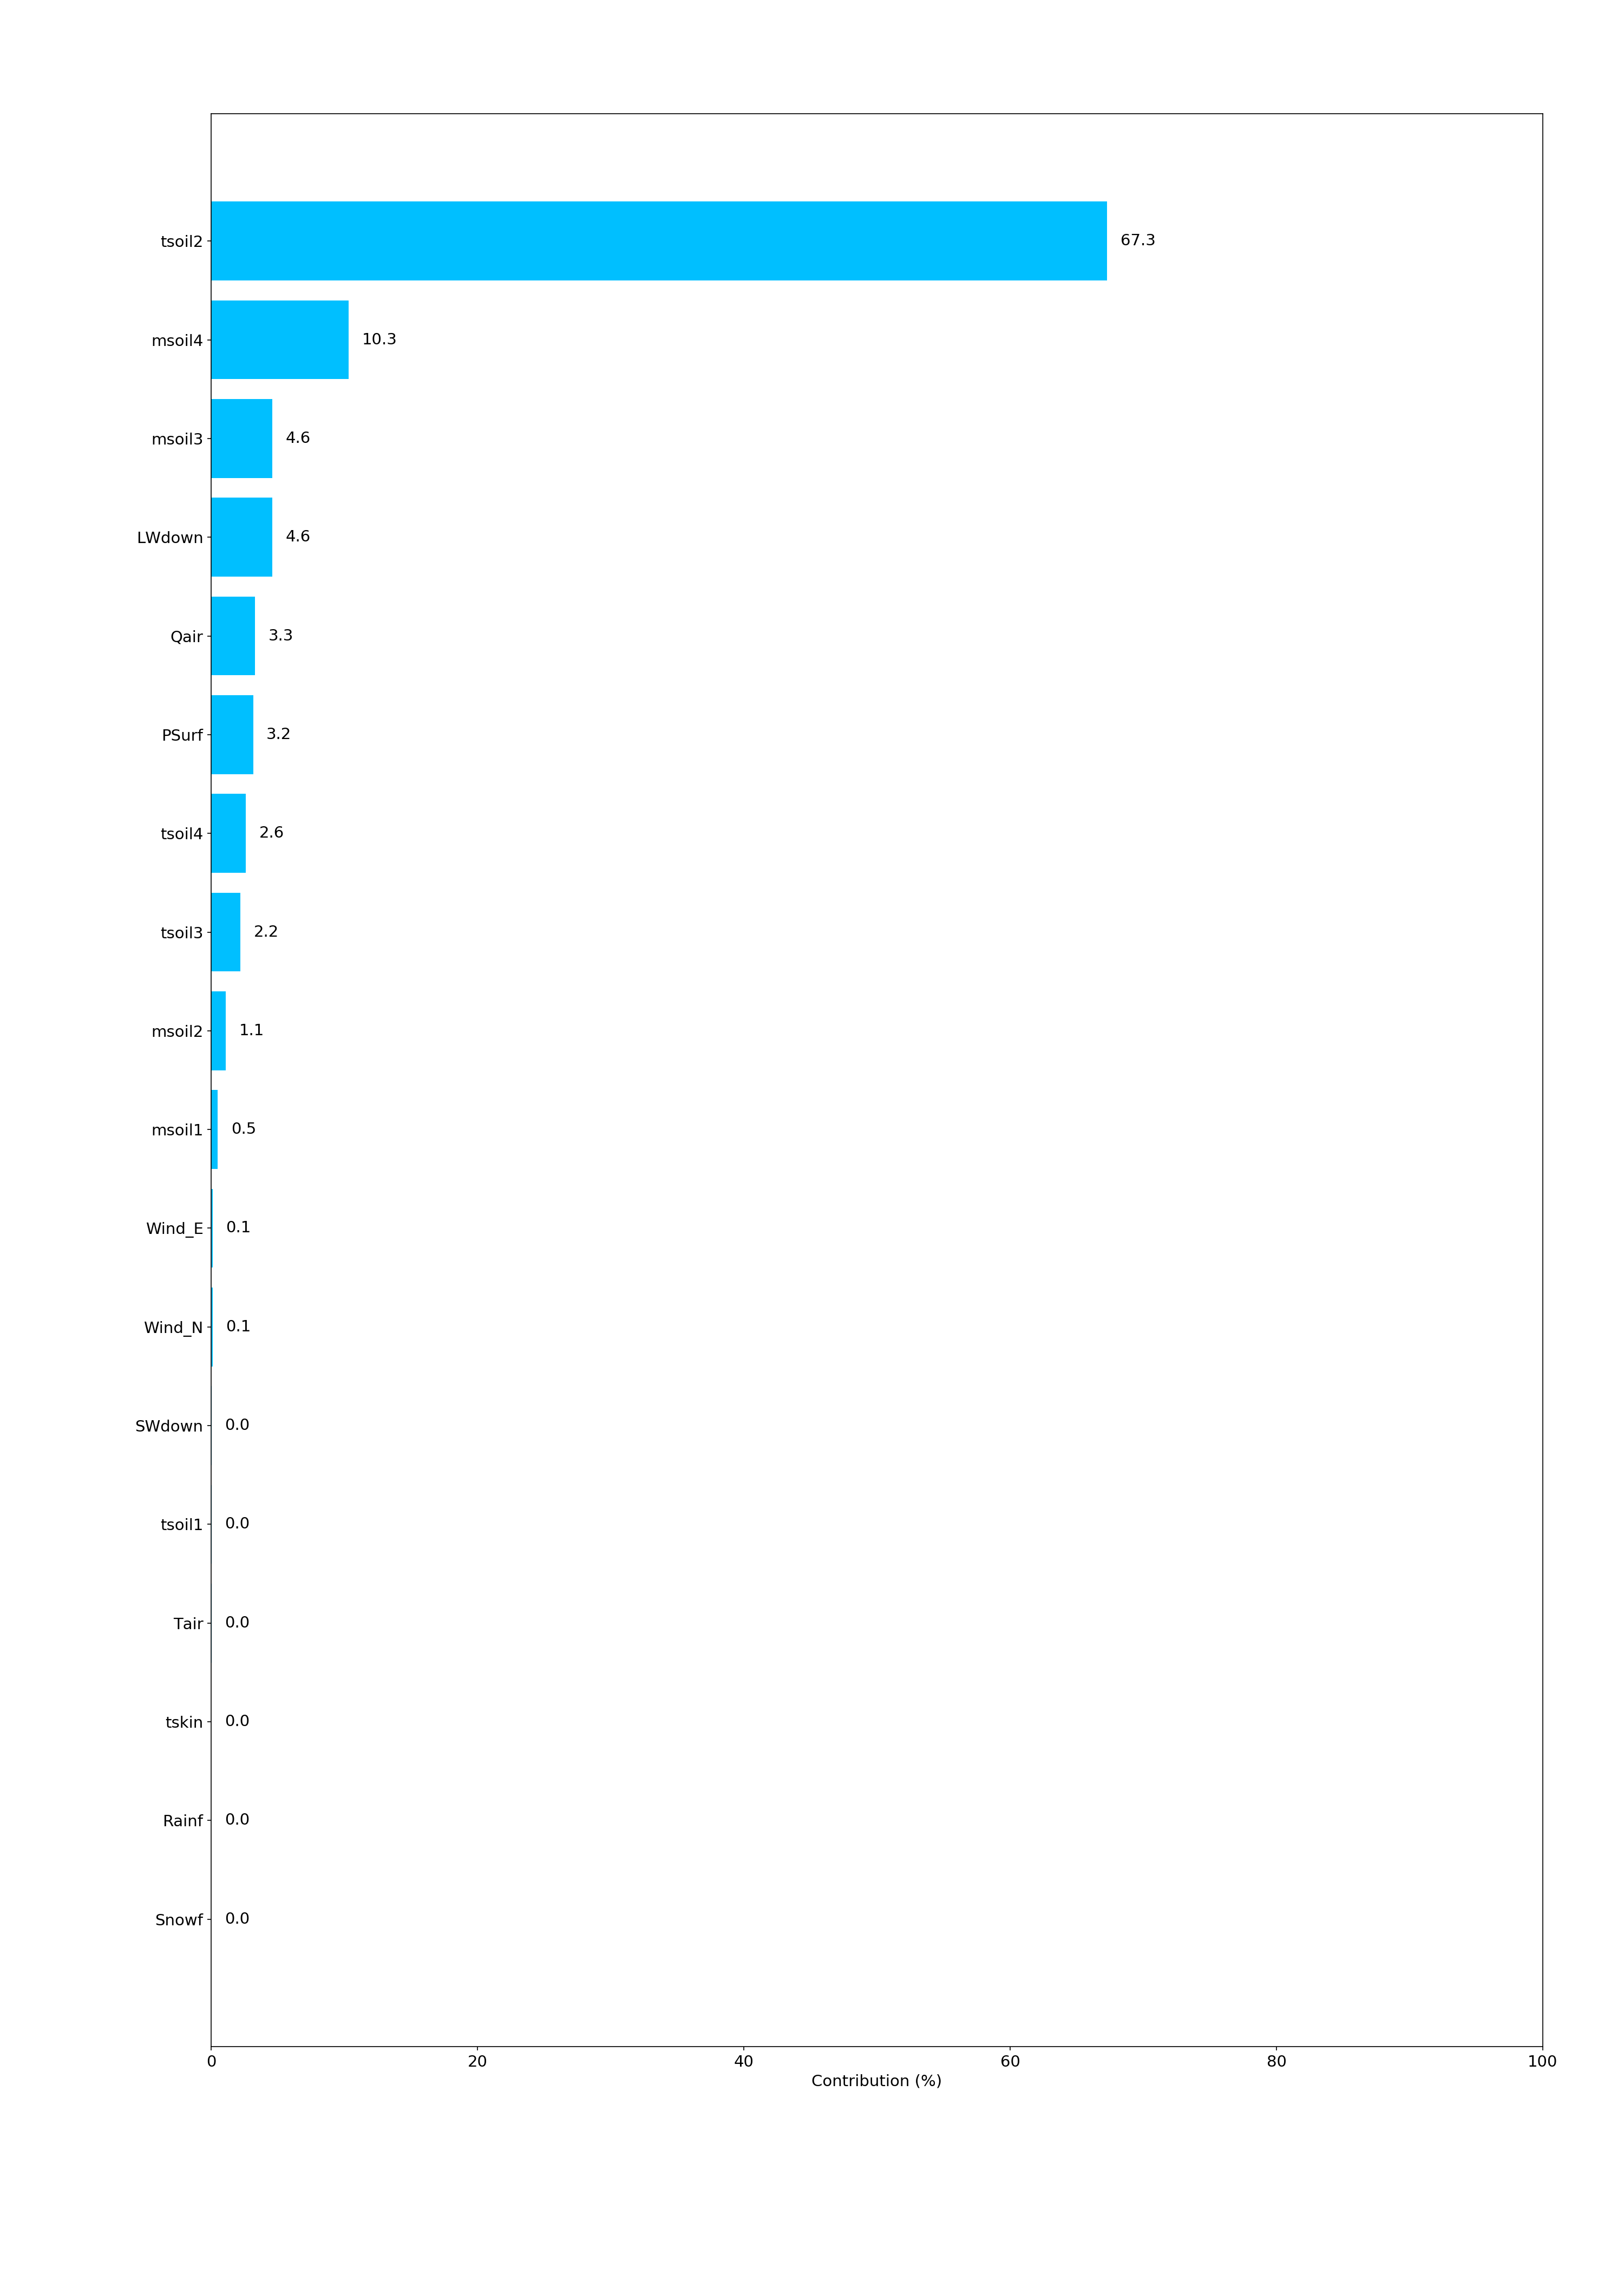
Since in most of the cases fitting a single model for the whole PFT could cause discrepancies between observed/simulated CH4 wetland fluxes, a prescribed updated Koeppen-Geiger Climate classification map is used where individual models are fitted per KG class and sub-region.
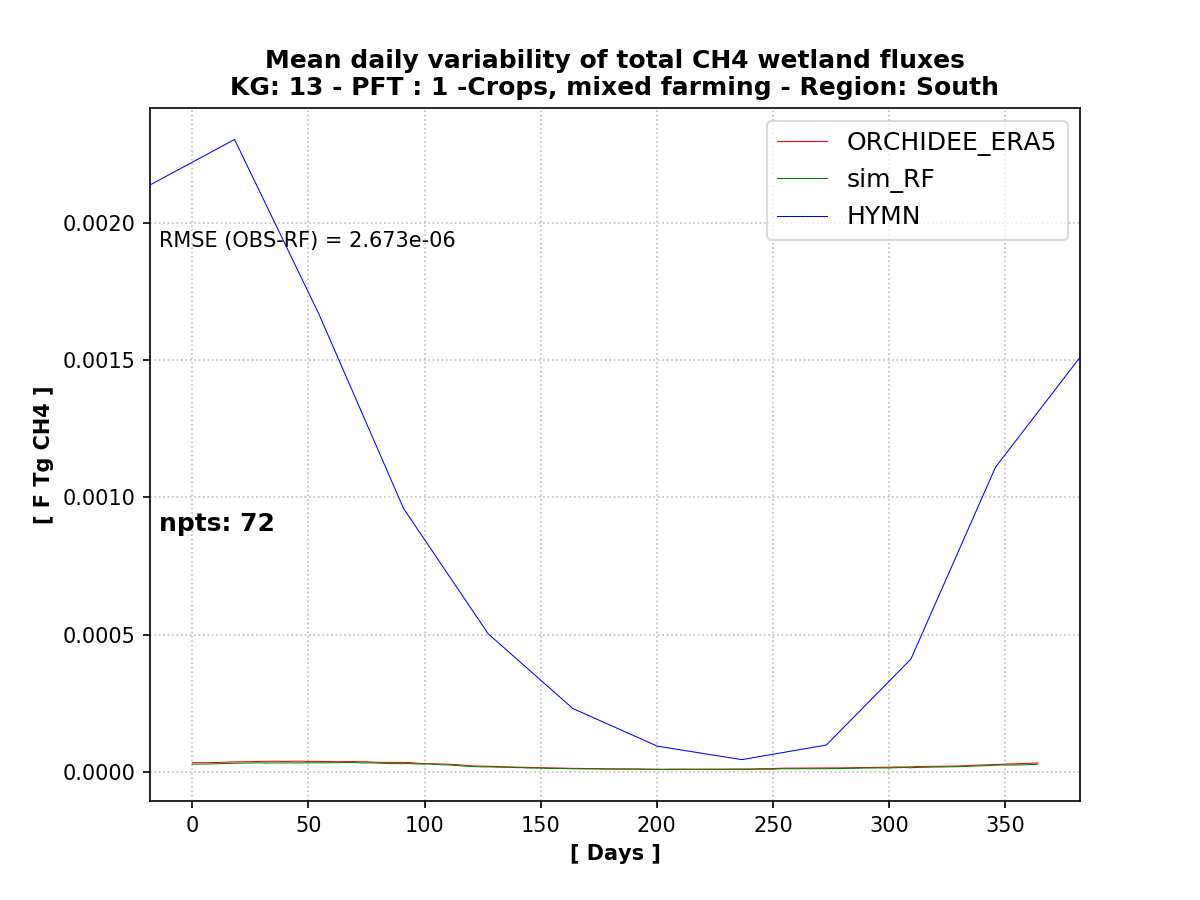
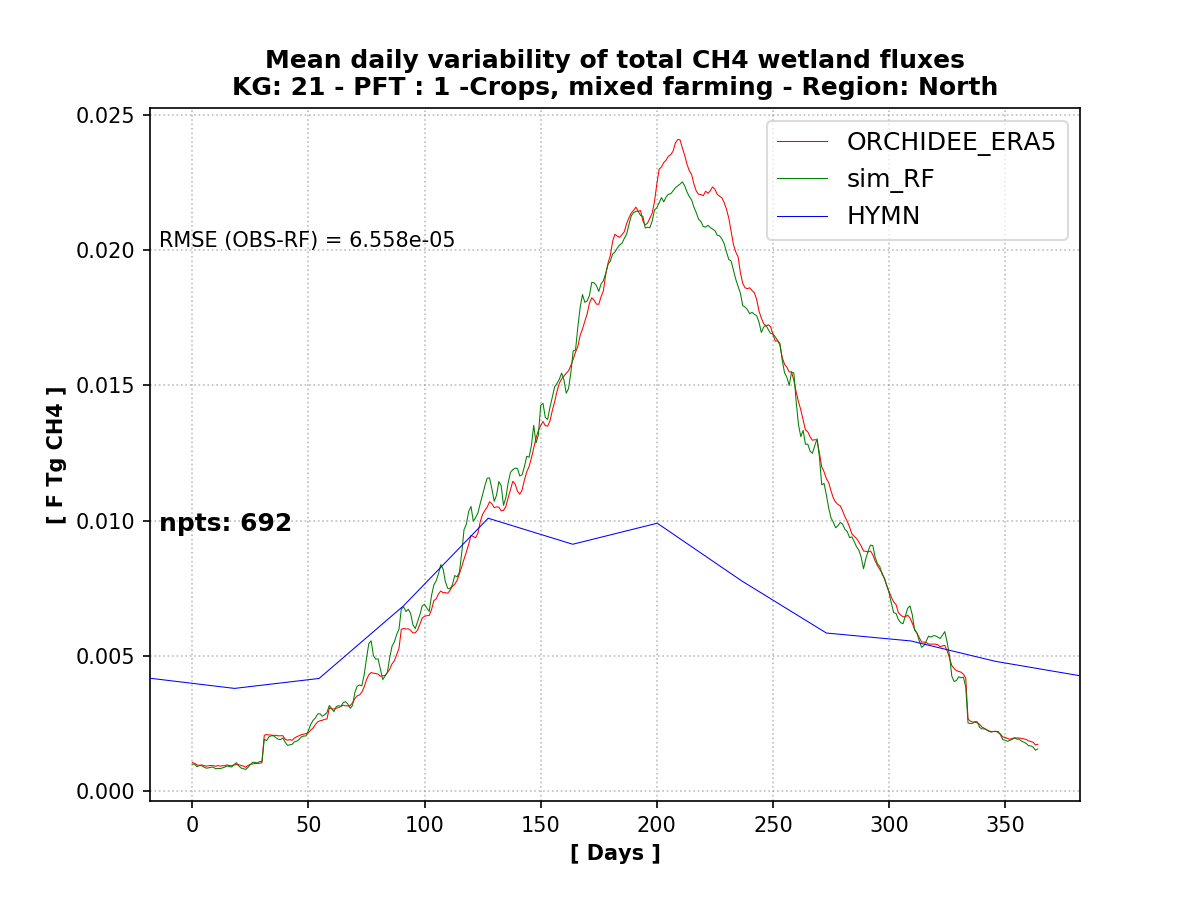
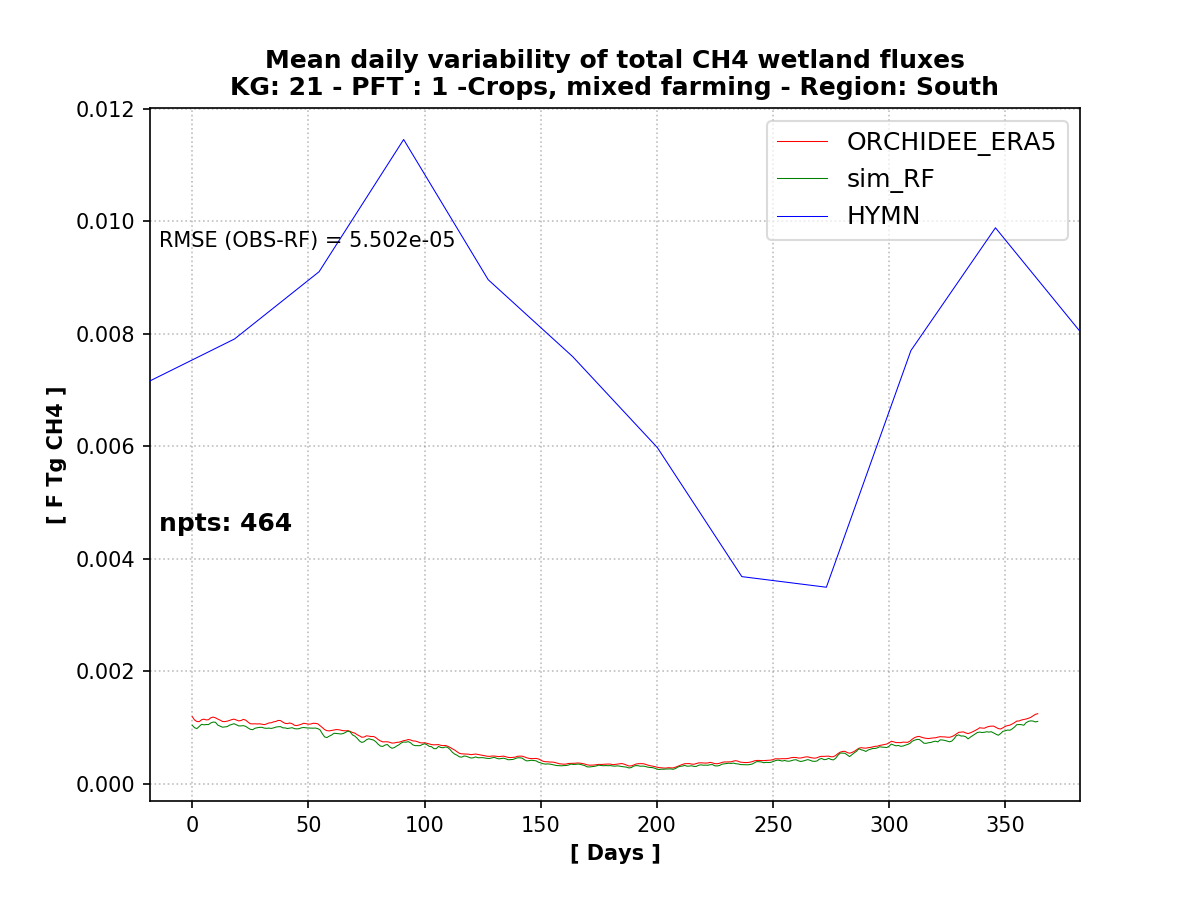
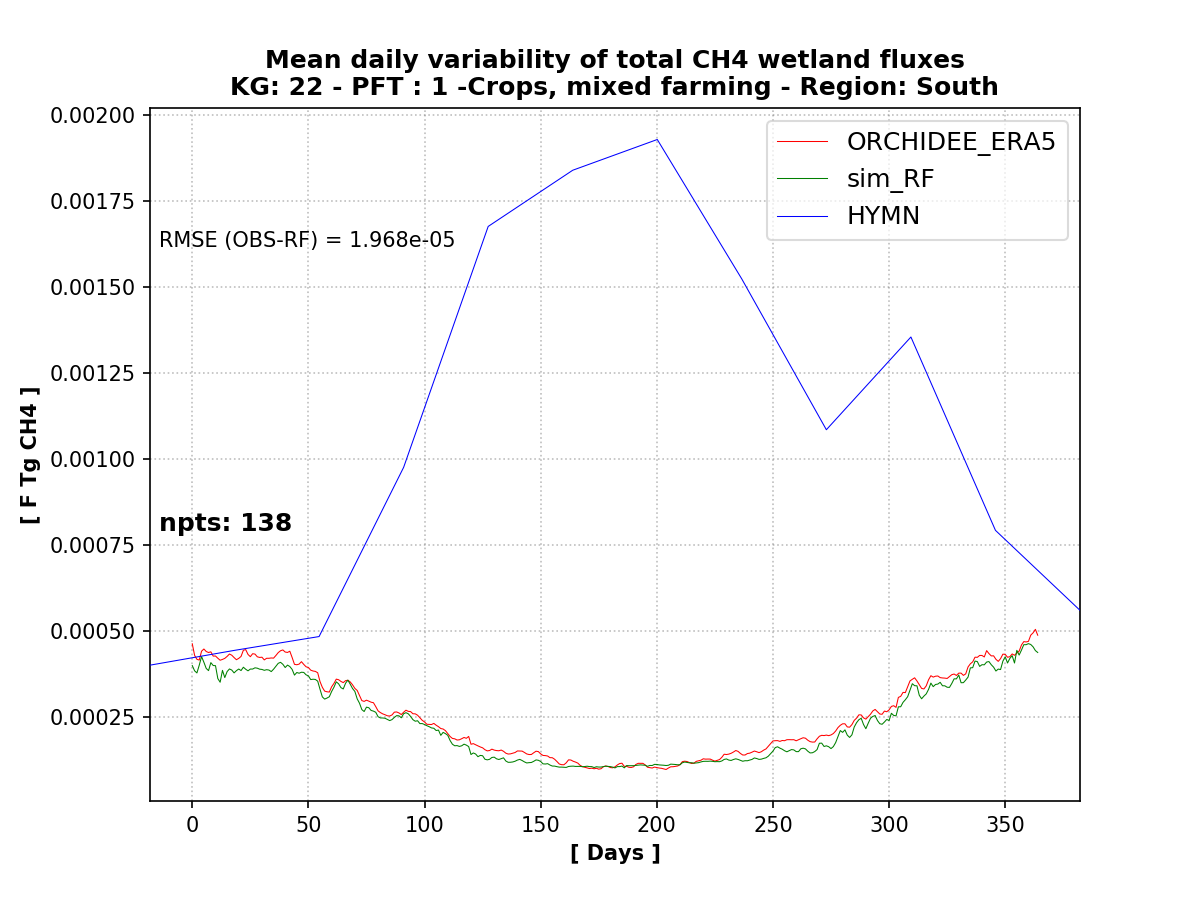
- How to read the results
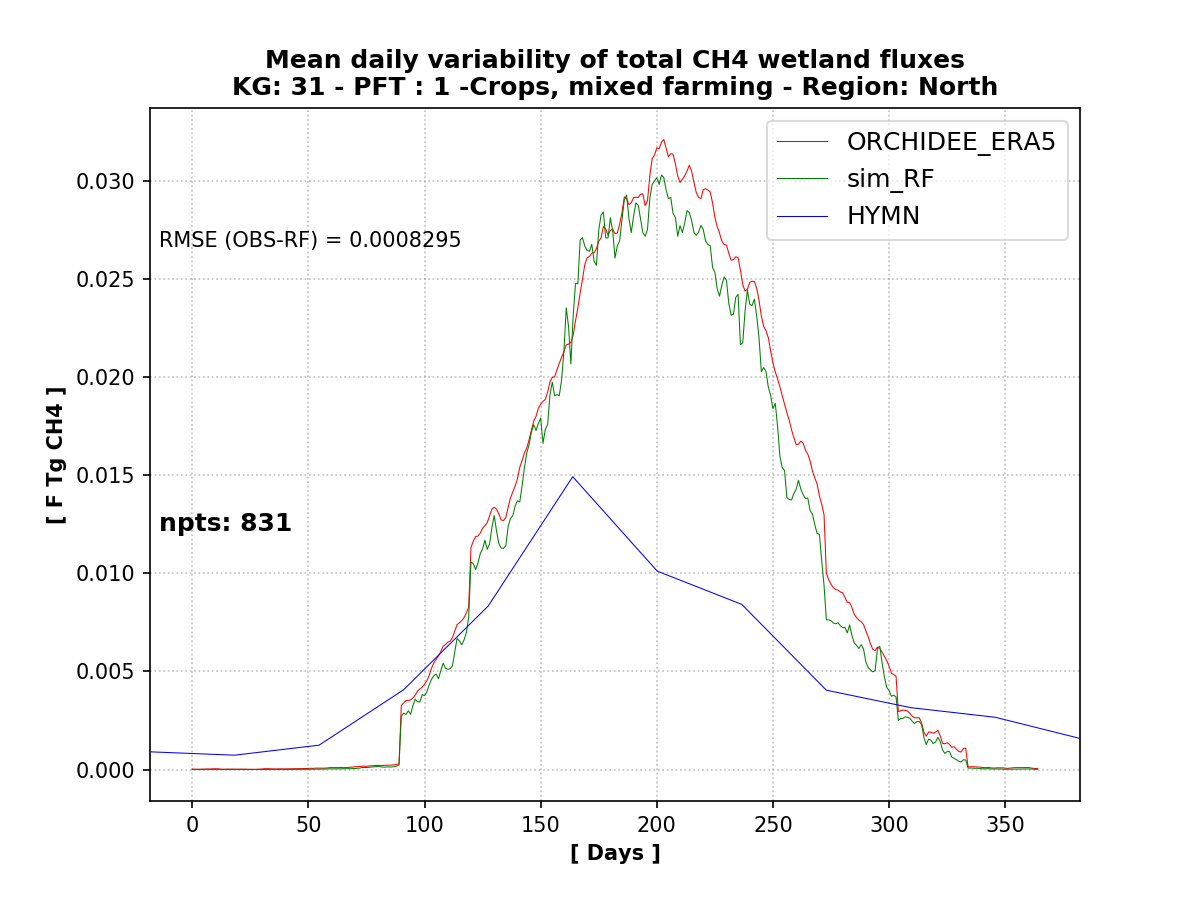
Plots depict the mean inter-hourly variability of CH4 wetland fluxes and the RMSE between the observed and the simulated CH4 wetland fluxes
Red line: ORCHIDEE_ERA5 CH4 wetland emissions
Green line: Simulated ERA5 CH4 wetland emissions
Blue line: HYMN ECMWF CH4 wetland emissions
Plot units are f gCH4 / hour (x axis) – hours of the year (y axis)
|