


CTESSEL developments


| | CTESSEL developments | | | ||
| orchidas : cams / CAMS41-CH4 / Fluxnet&GCP | Site Map |
Project CAMS41 Phase 2
Optimization of CH4 wetland emissions in CTESSEL model using FLUXNET-CH4 dataset and GCP inversion products
The optimization is performed in two steps:
1. Optimization of Q10
For the optimization 22 sites have been selected. All site simulations are performed with the same CTESSEL configuration:
The optimization is performed in multiple-site mode with 23 optimized parameters: s (individual scaling factor for each site) and Q10 (temperature dependency factor). The resulting Q10 value and site time-series are shown below.
| Parameter | Prior | Min | Max | Posterior |
| Q10 | 2.0 | 1.01 | 4.0 | 2.337 |
| ID | MAP | TIME-SERIES |
| CA-SCB | 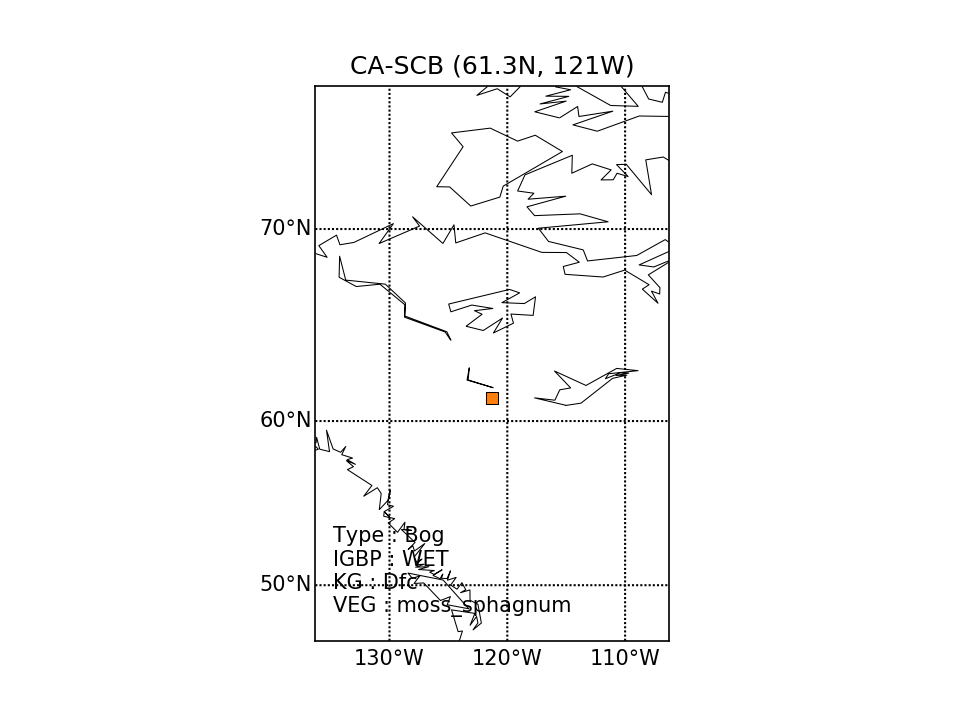 | 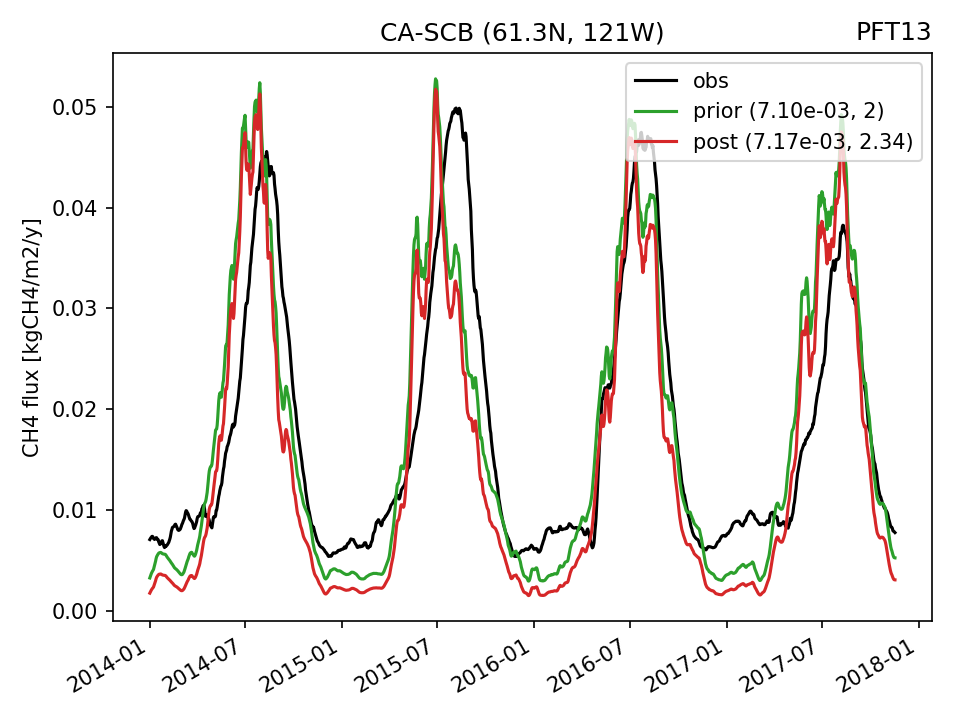 |
| DE-Hte | 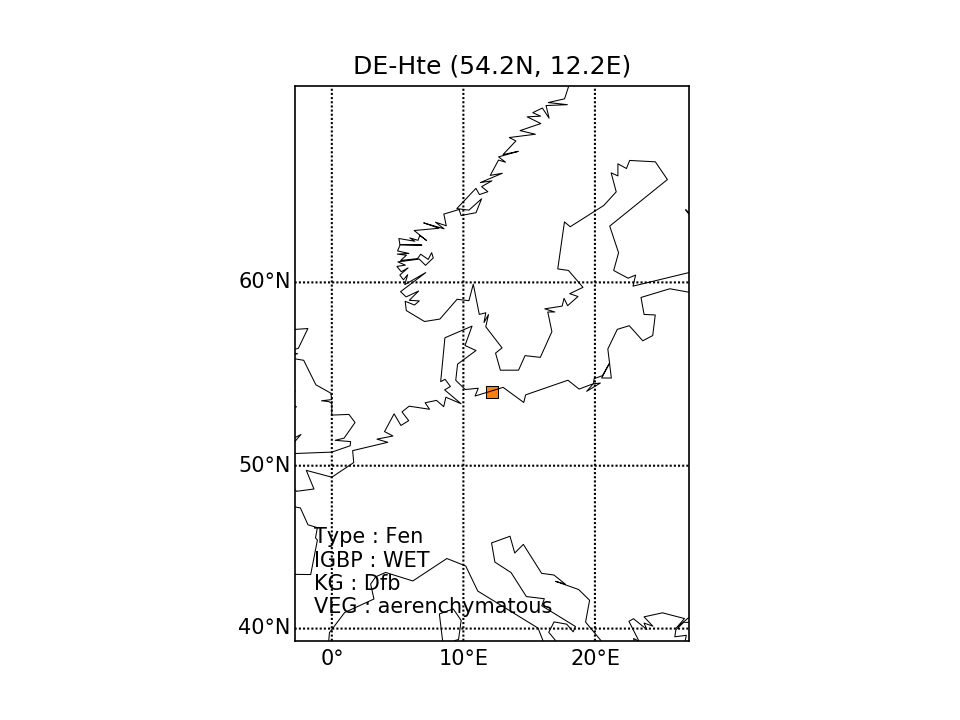 |  |
| DE-SfN |  | 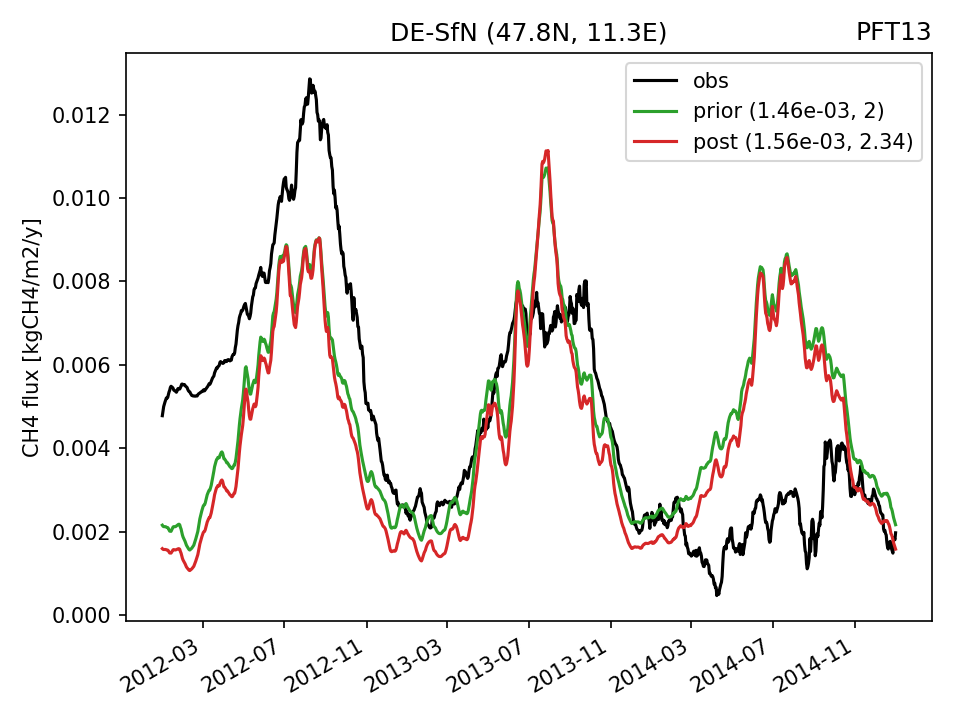 |
| FI-Si2 | 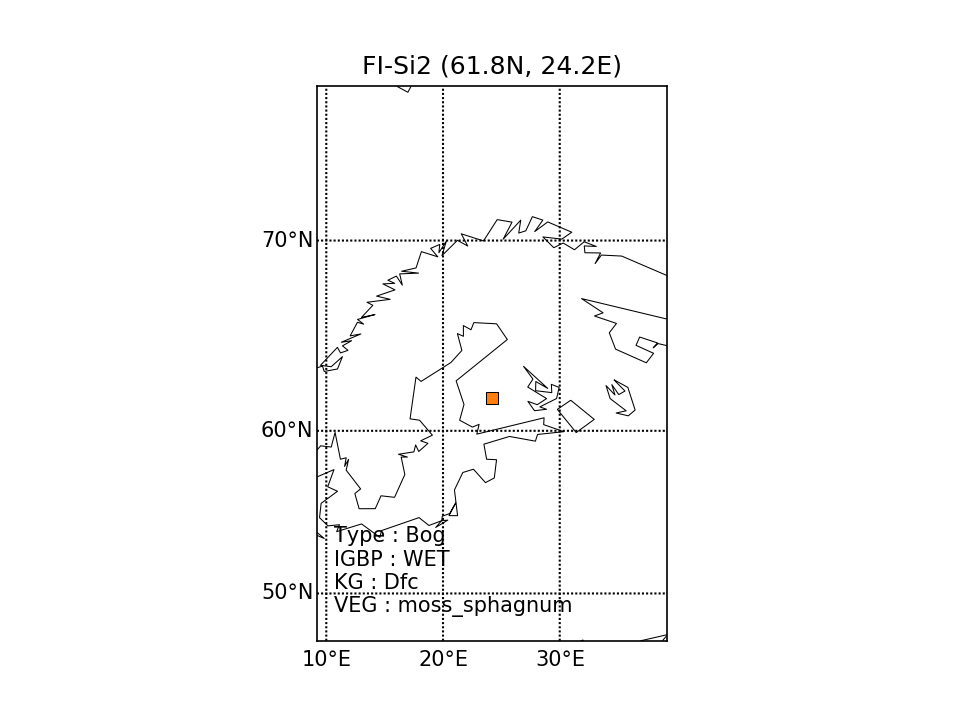 | 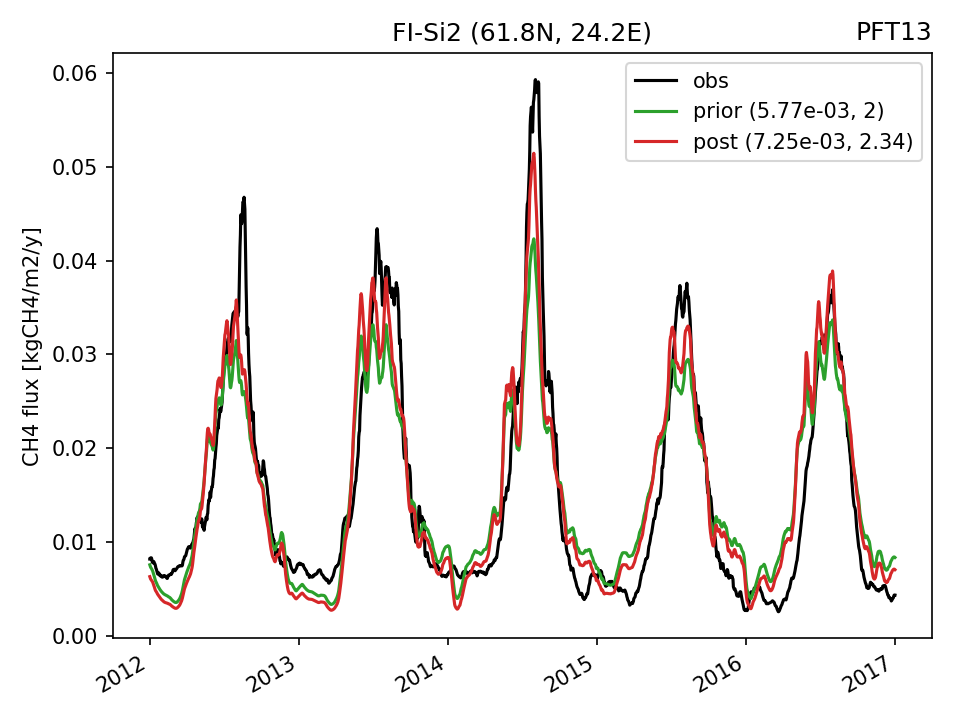 |
| FI-Sii |  | 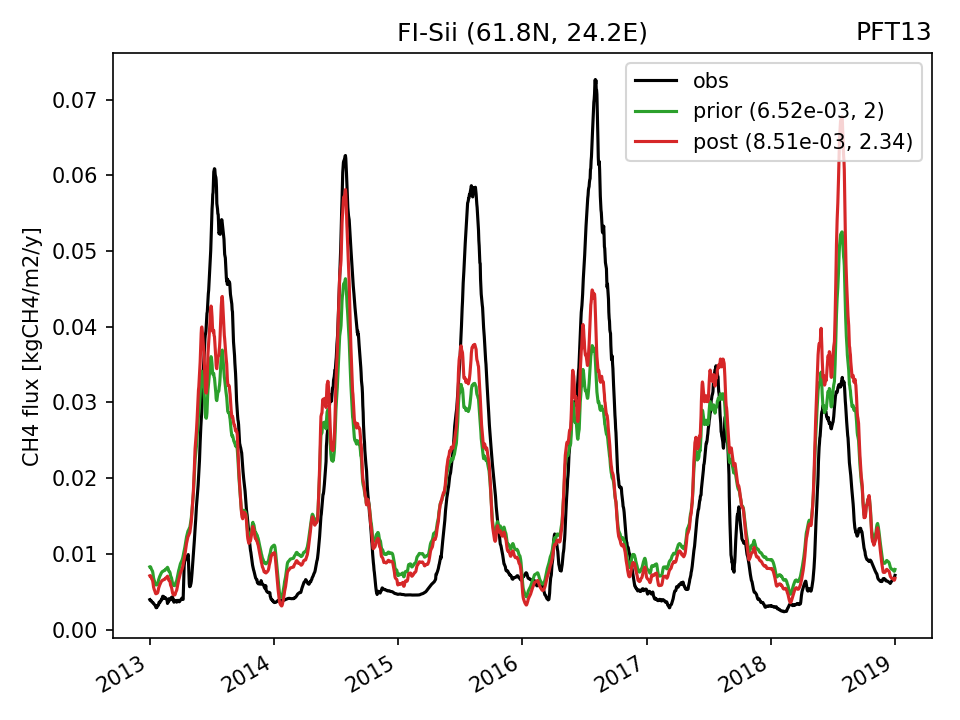 |
| IT-Cas | 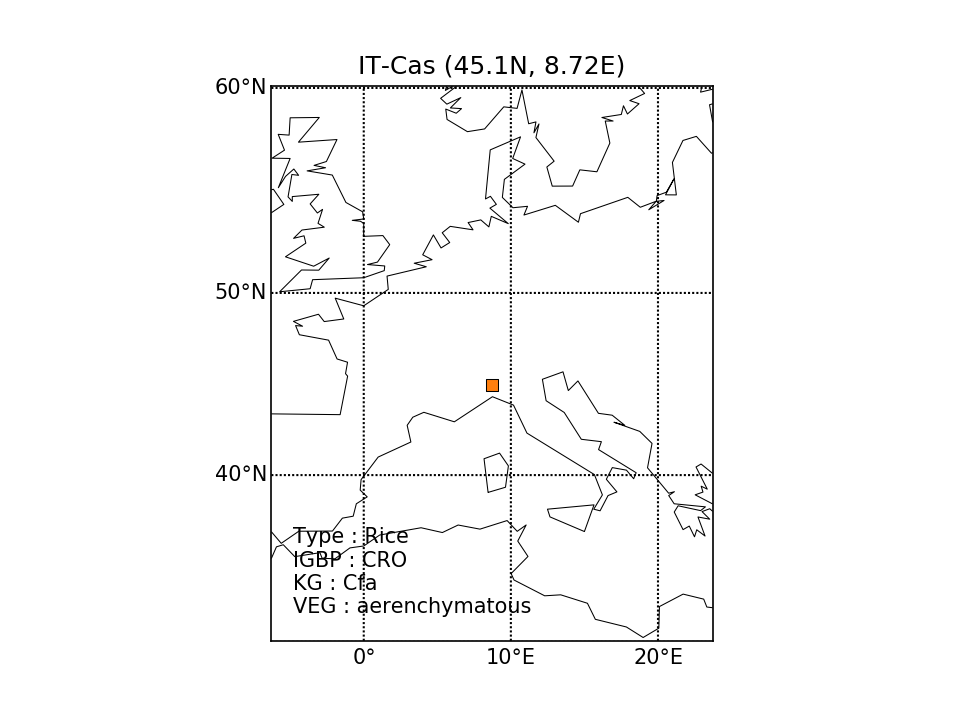 | 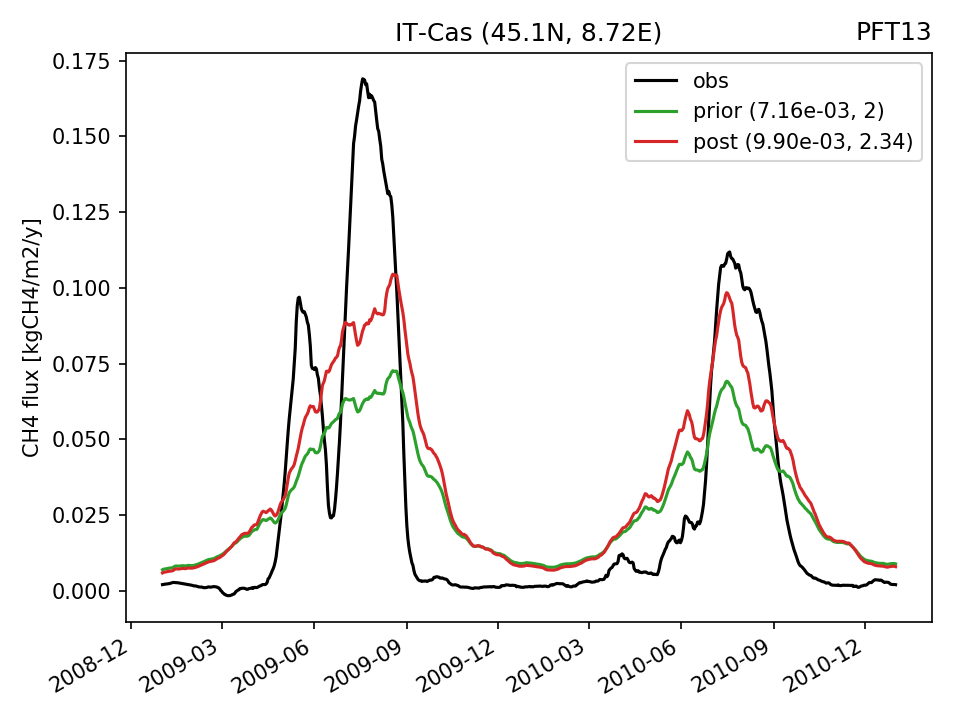 |
| JP-BBY | 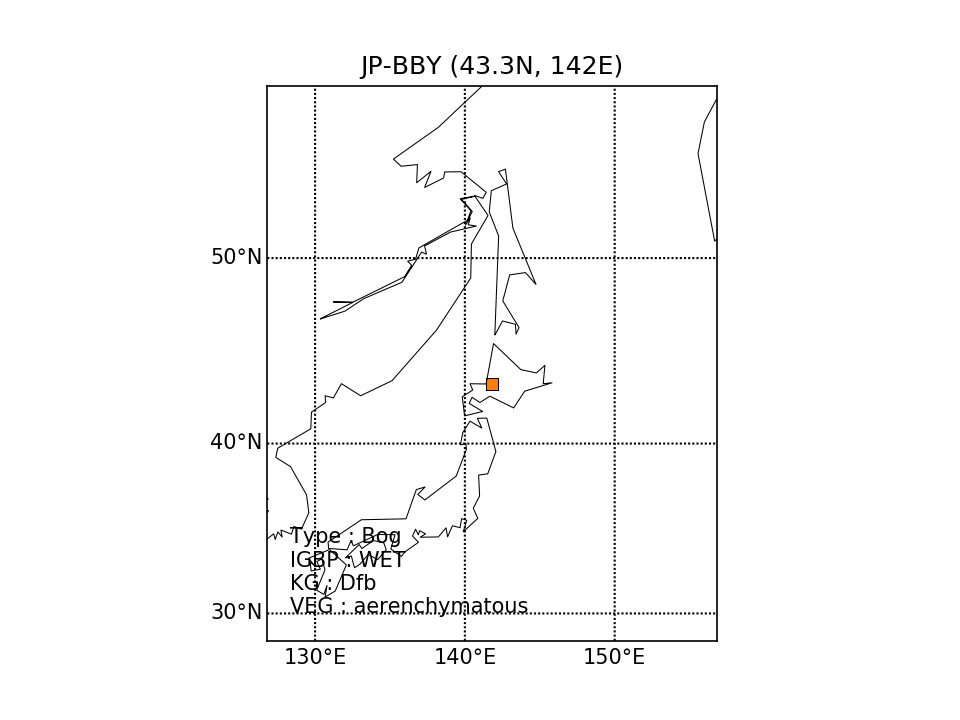 |  |
| KR-CRK | 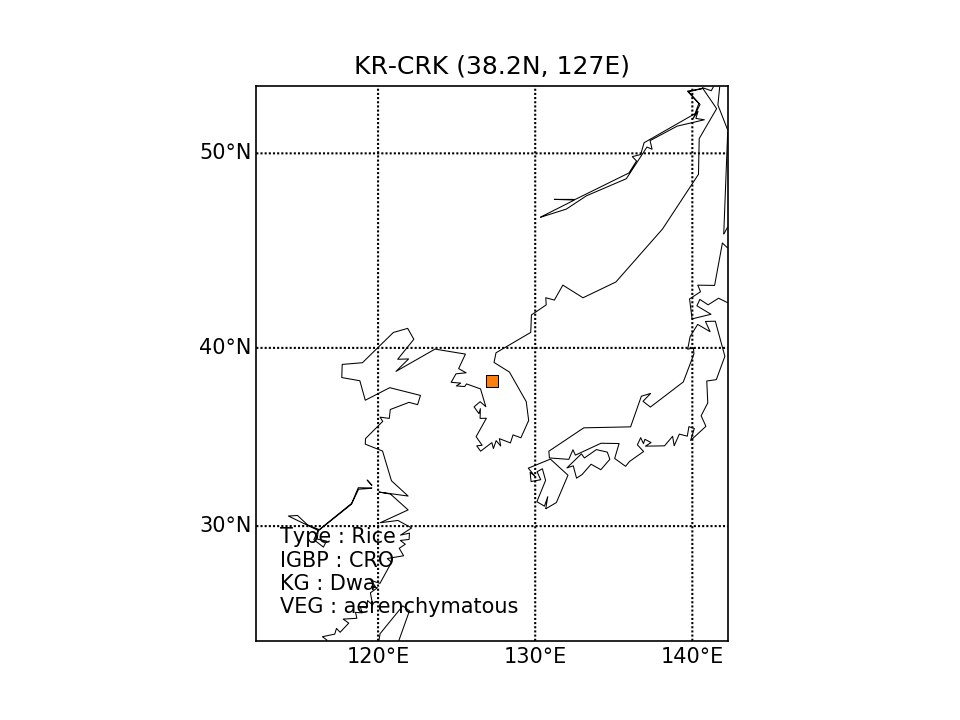 | 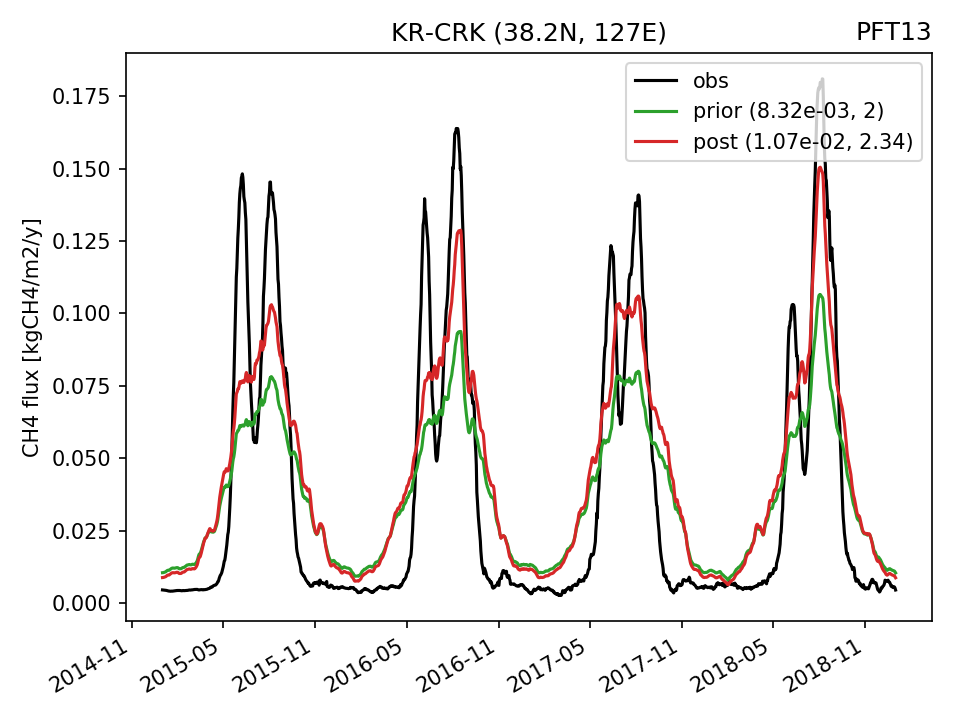 |
| NZ-Kop | 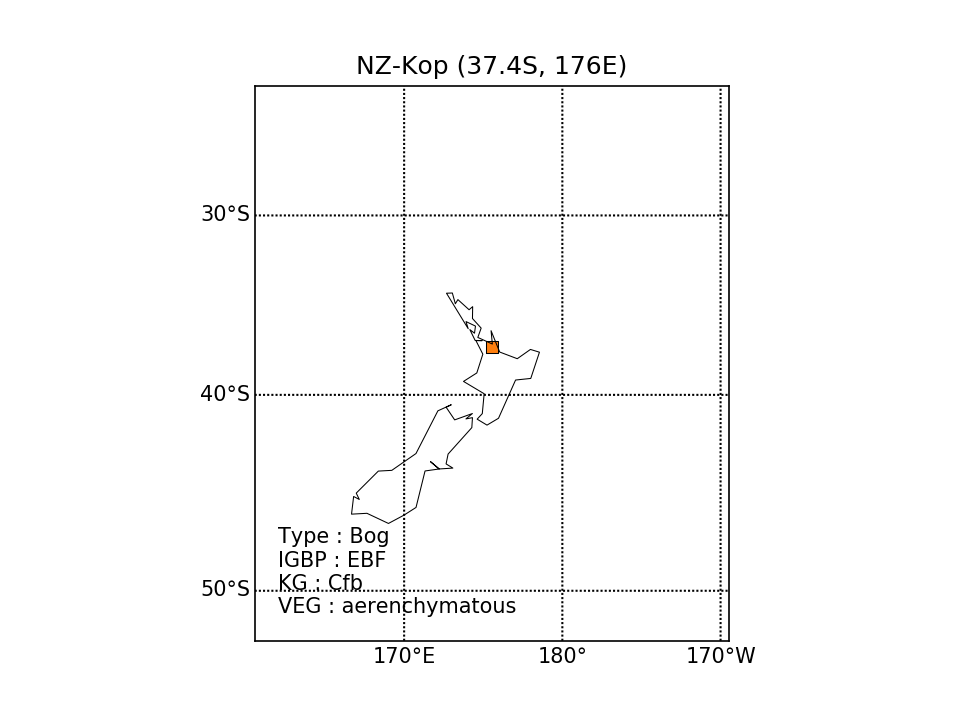 | 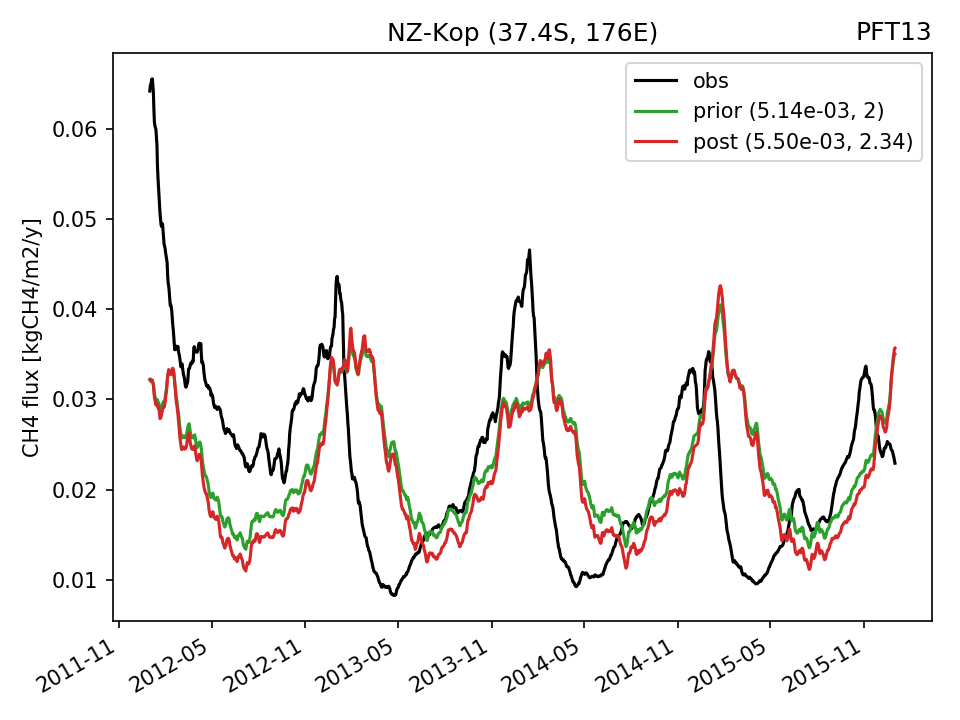 |
| RU-Ch2 | 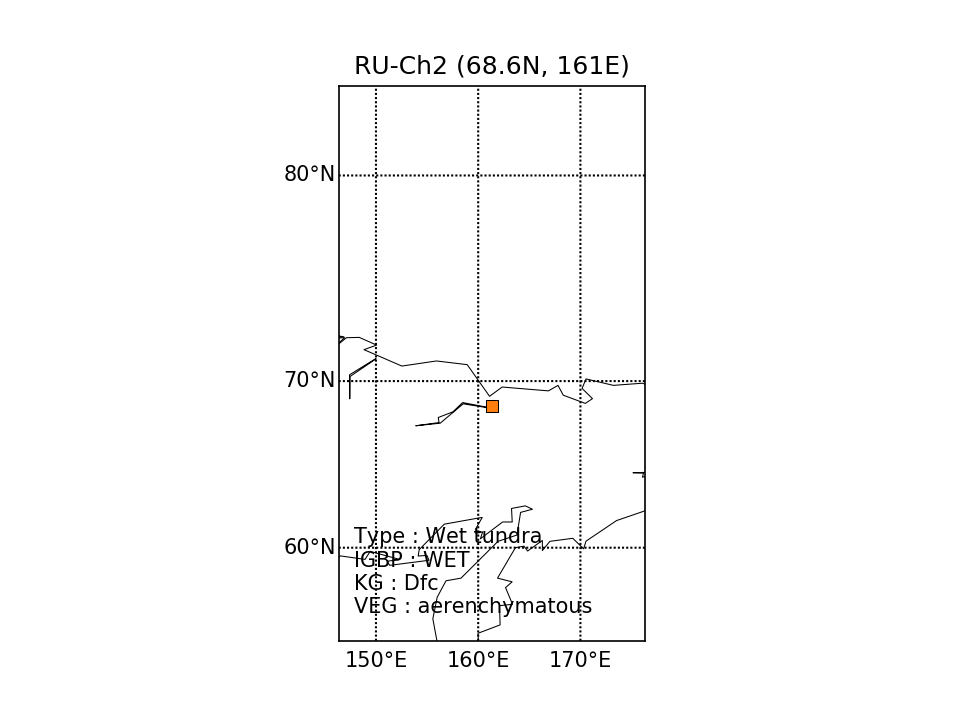 | 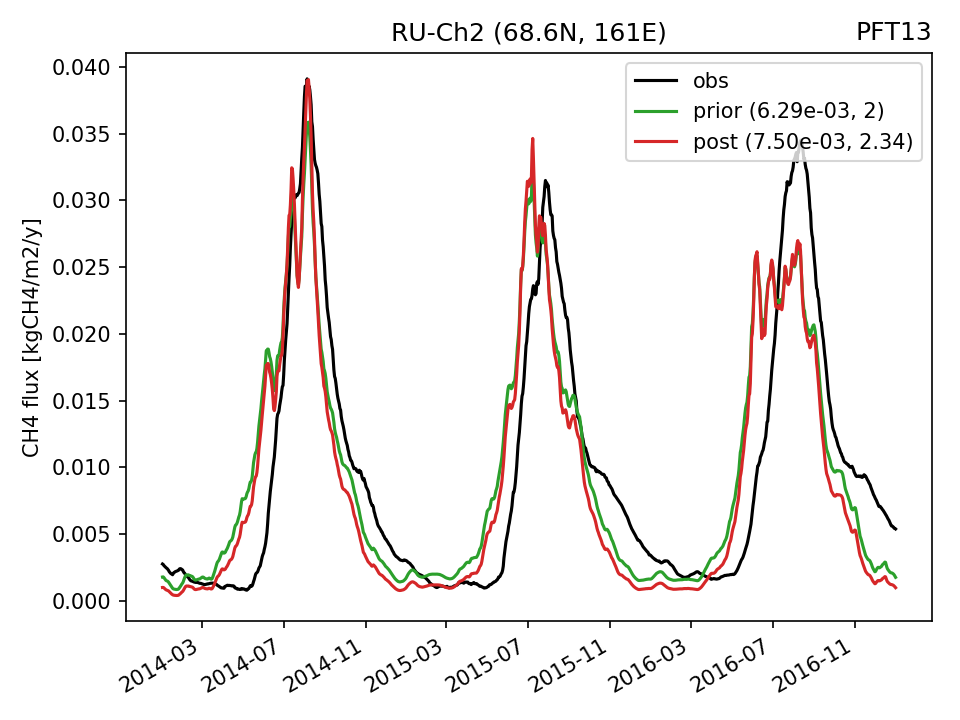 |
| RU-Che |  | 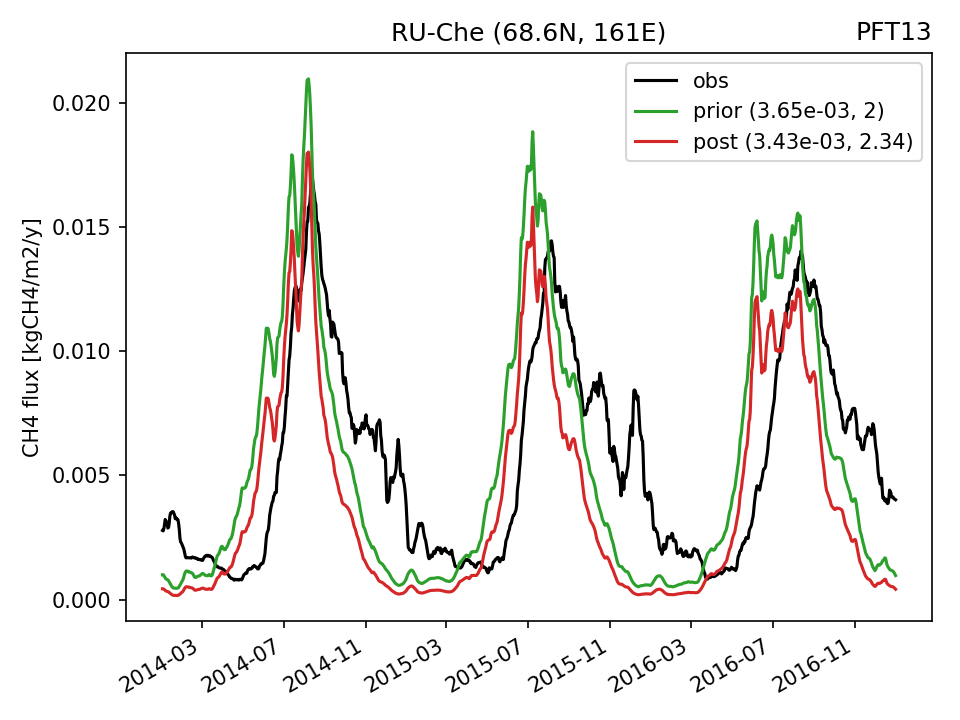 |
| SE-Deg |  | 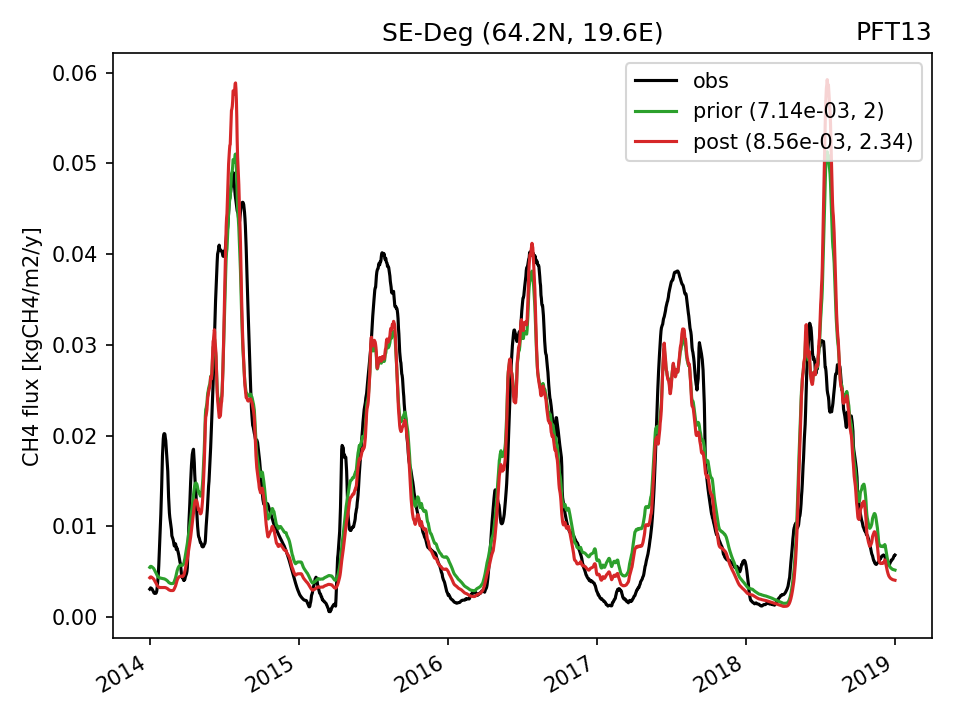 |
| US-A03 | 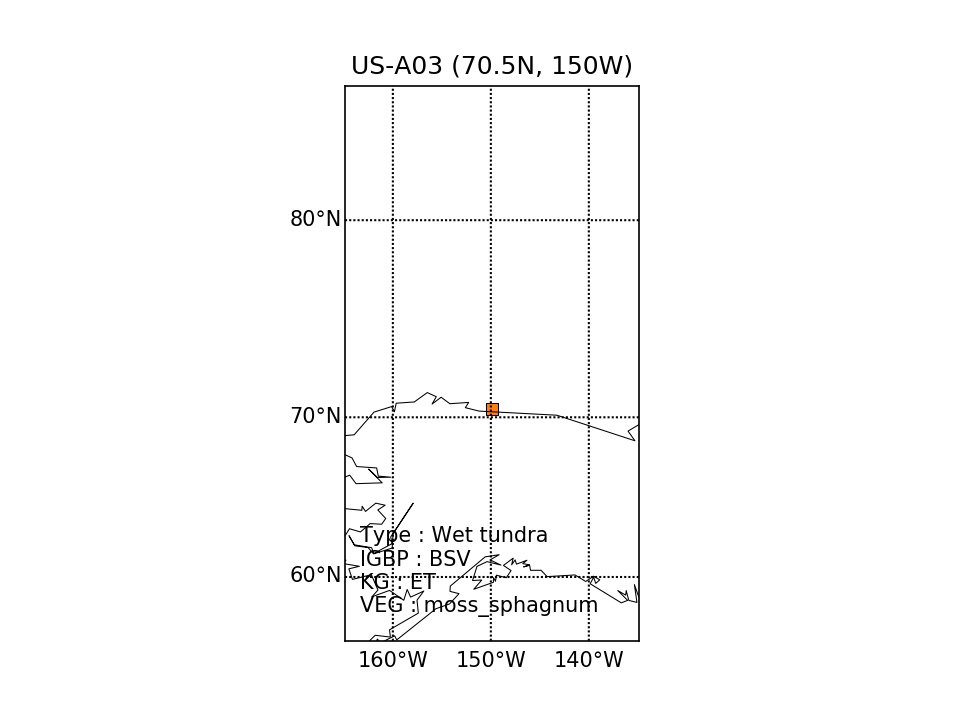 | 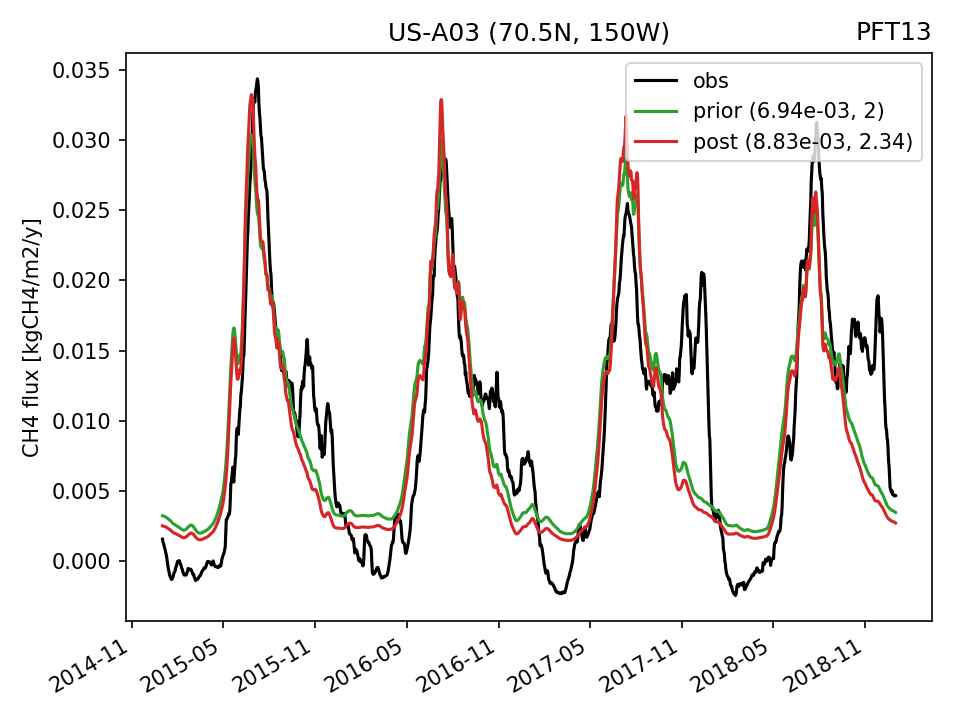 |
| US-BZF | 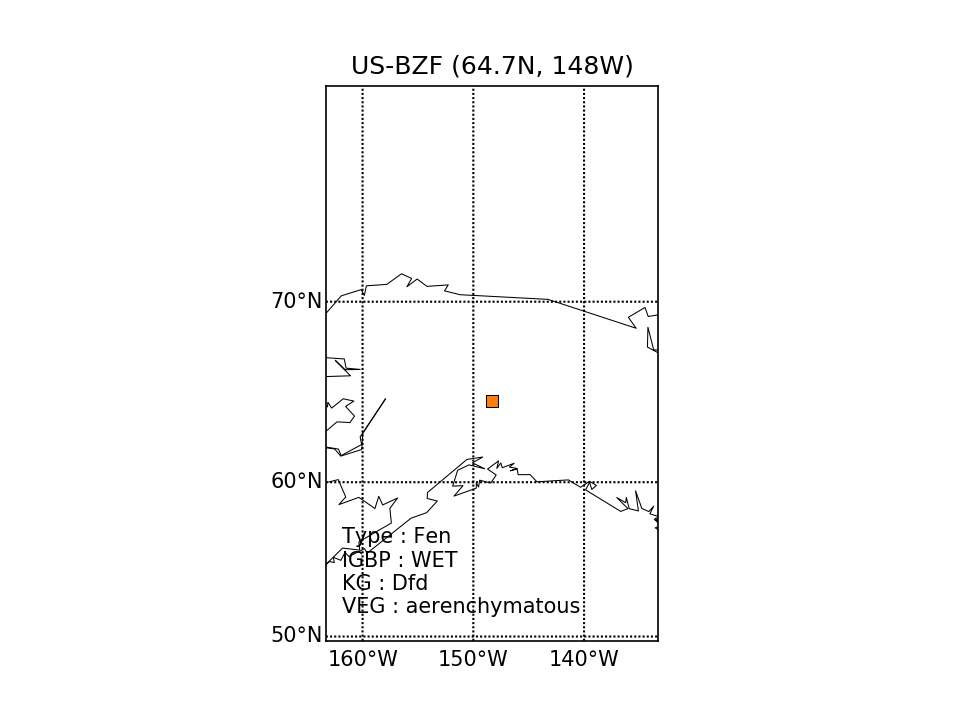 | 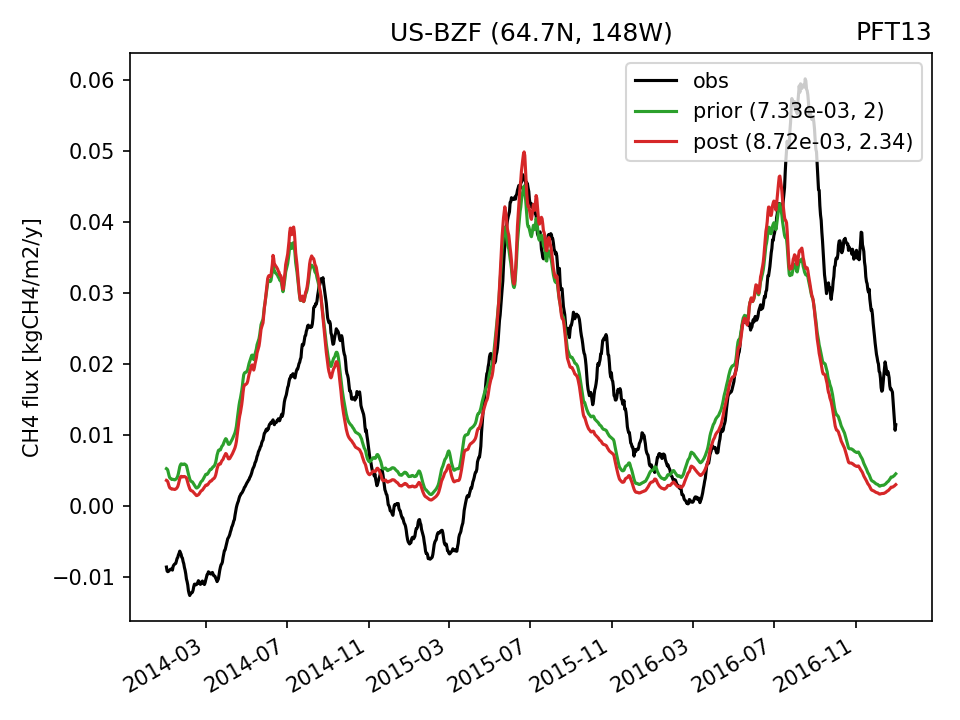 |
| US-Bes | 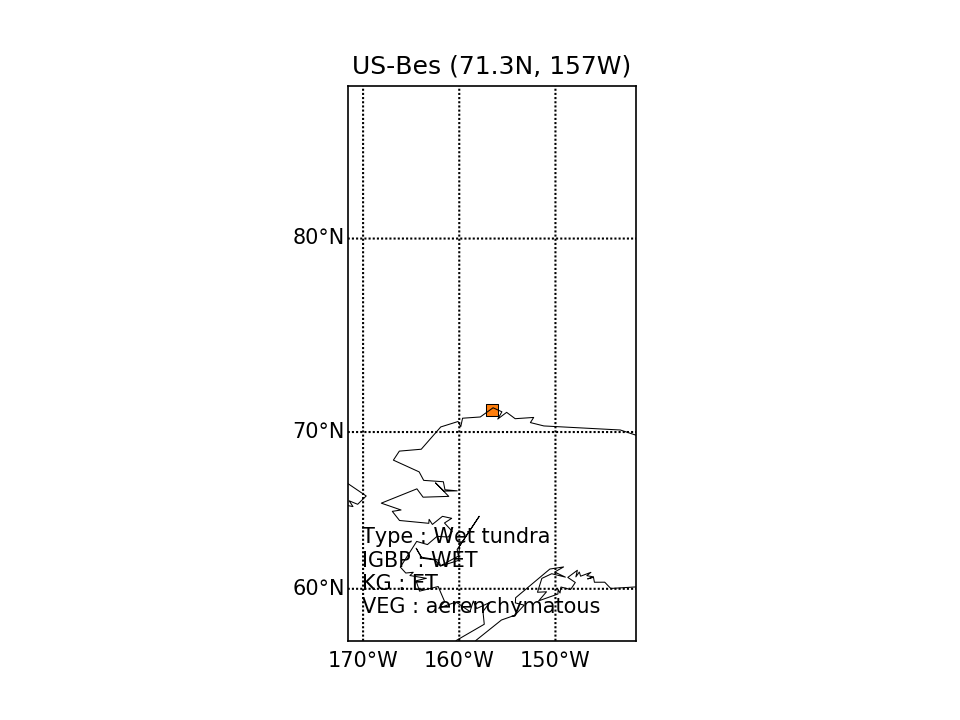 | 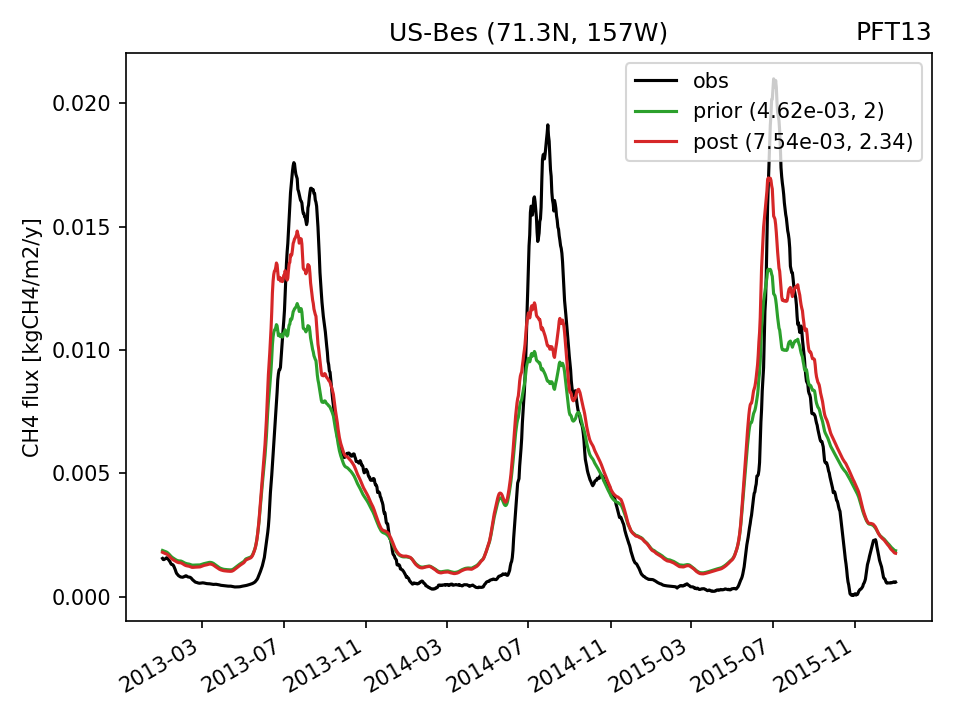 |
| US-LA2 | 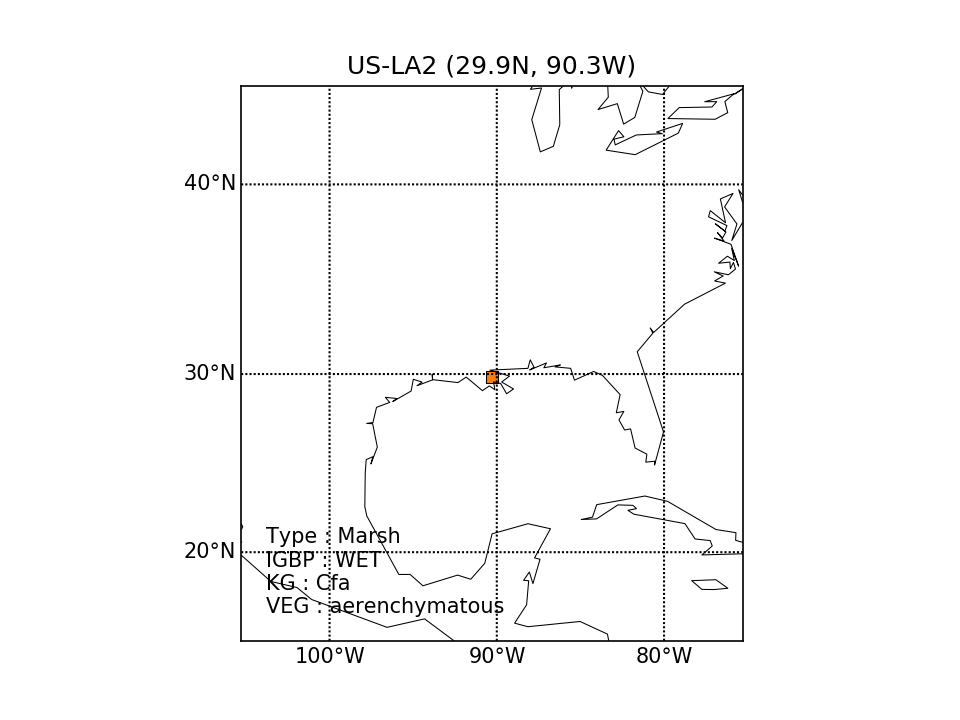 | 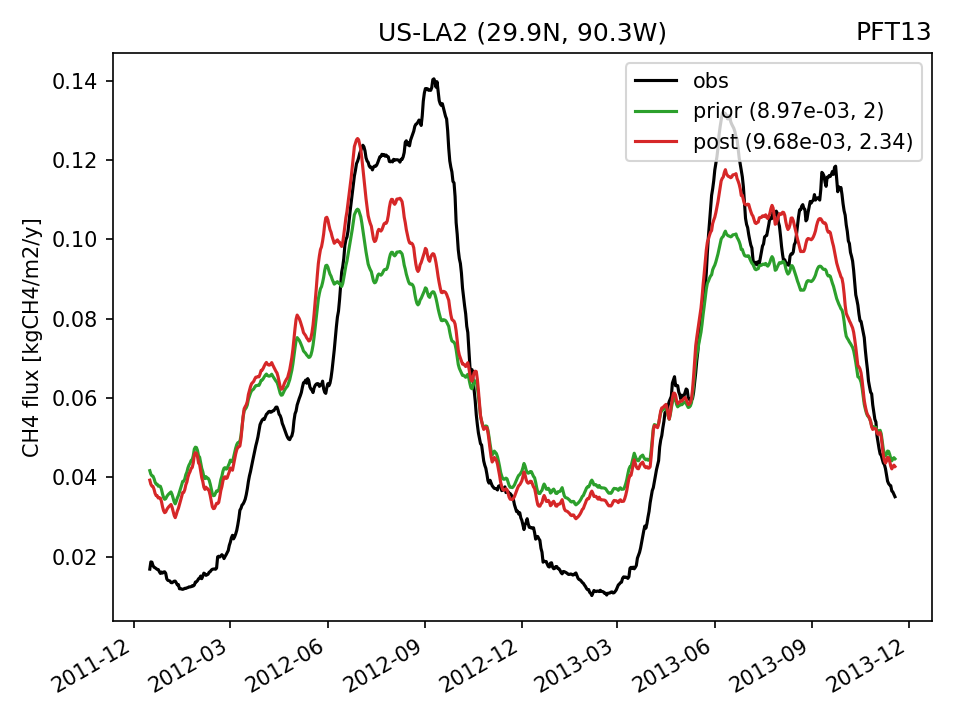 |
| US-Los |  | 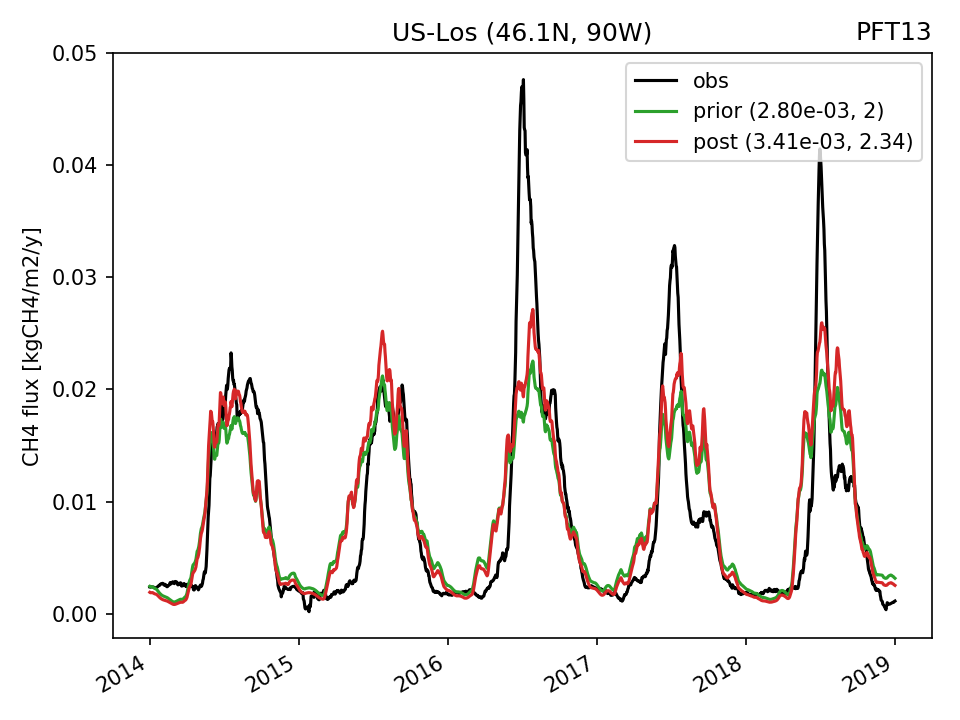 |
| US-Myb | 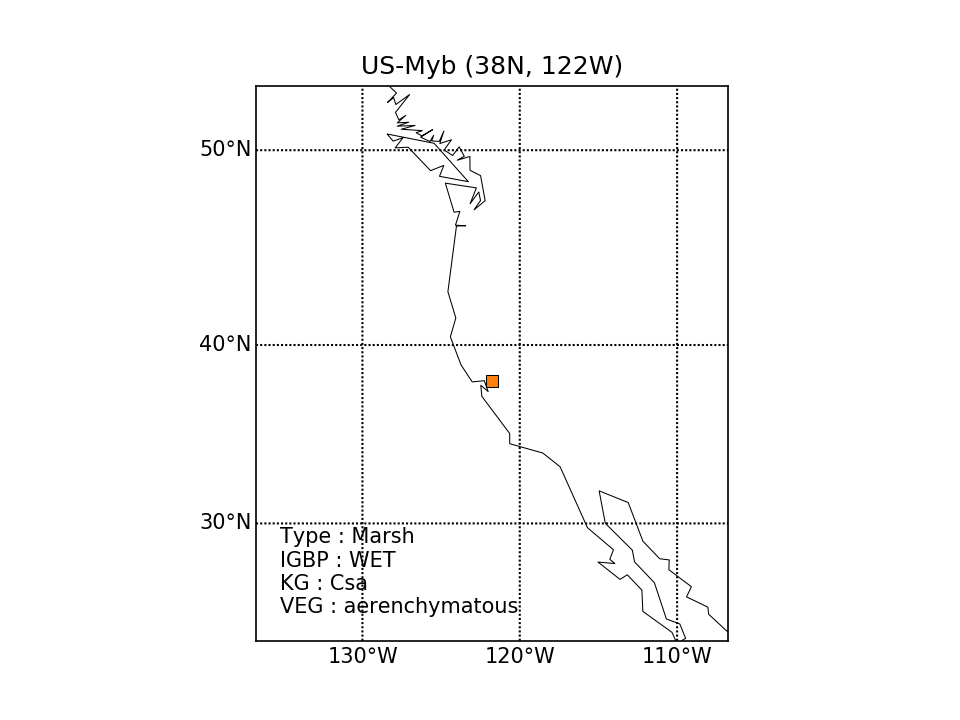 | 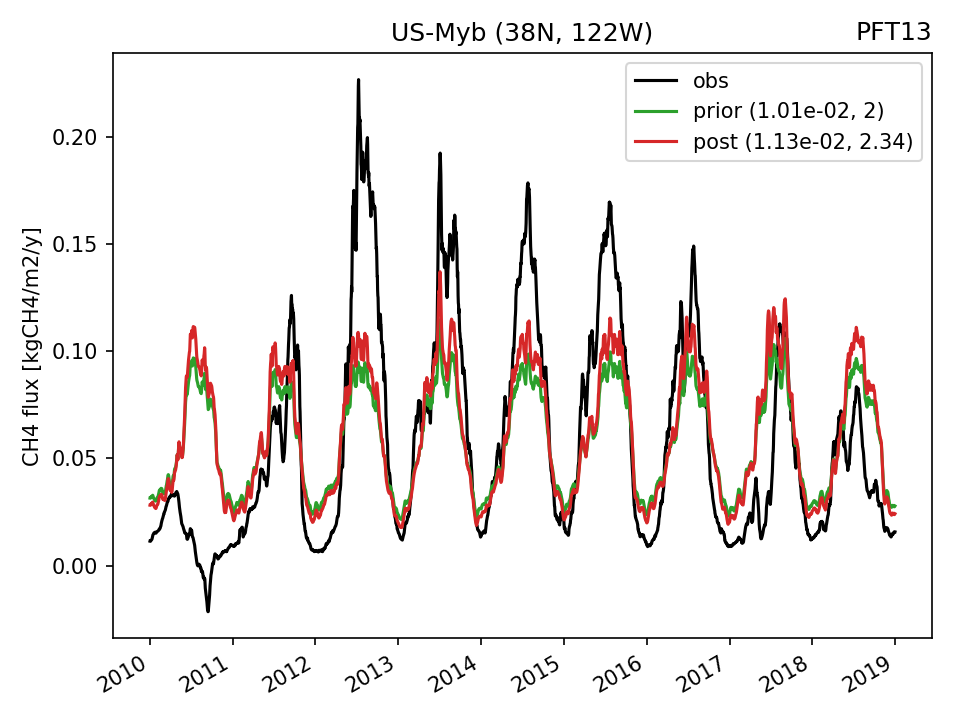 |
| US-NC4 | 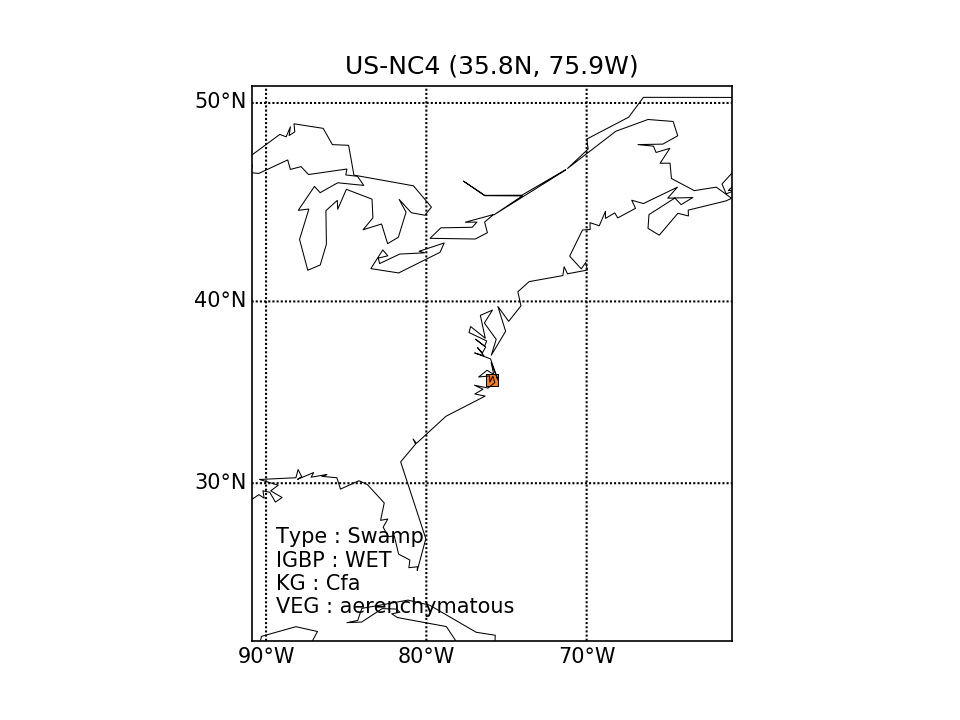 |  |
| US-PFa |  | 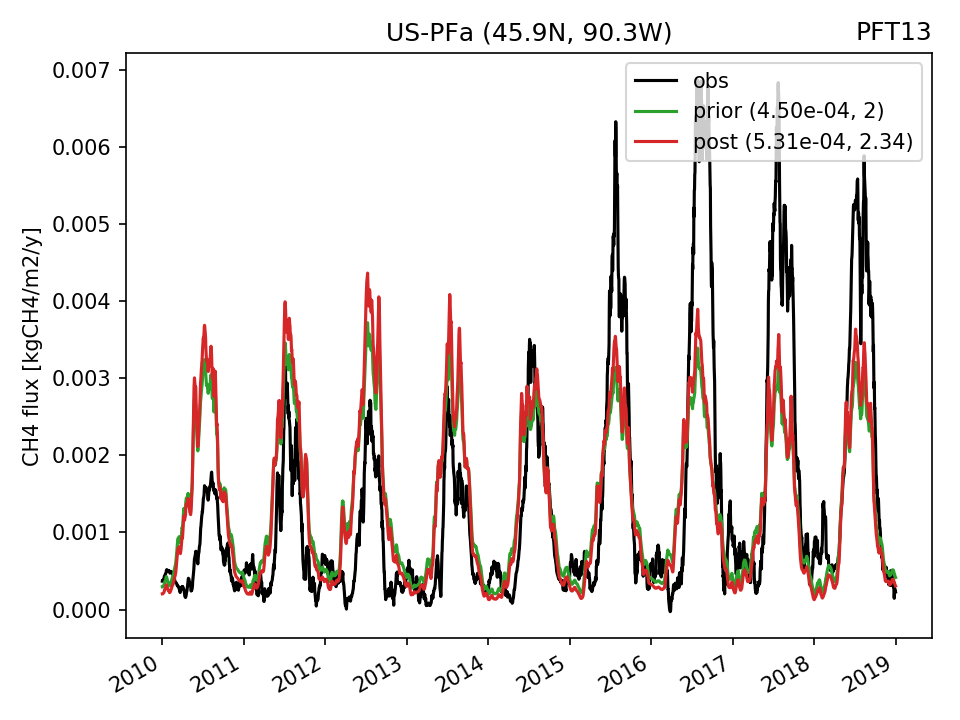 |
| US-Tw1 |  | 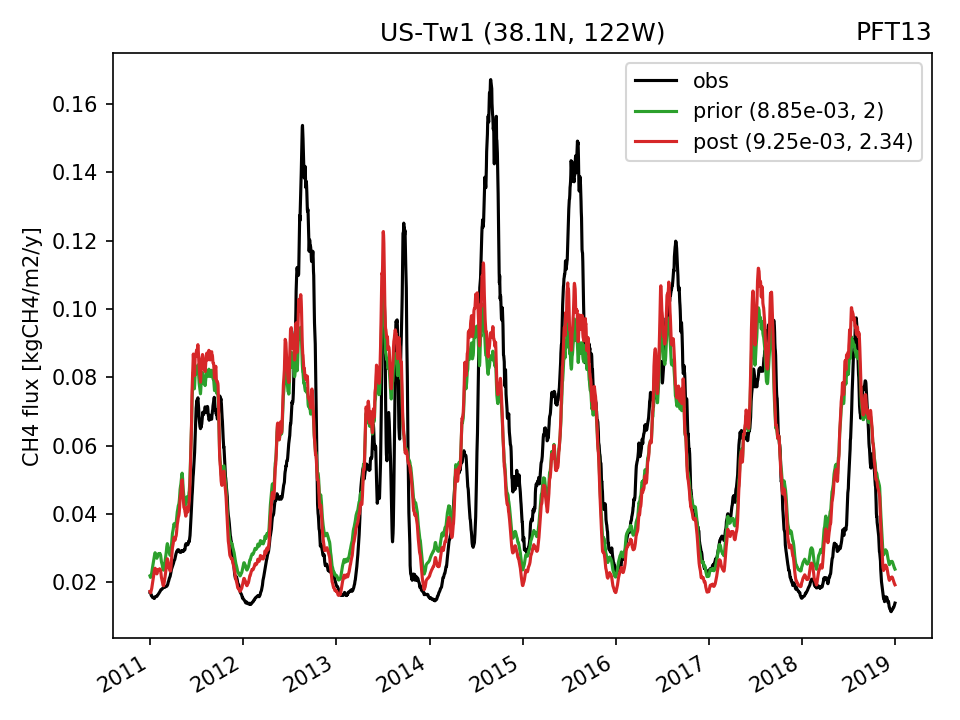 |
| US-WPT |  |  |
2. Optimization of S
For optimization of the scaling factor the GCP-2019 inversion products have been used (median across 11 products). The global CTESSEL simulation is performed with E2OBS forcing for 2012-2014 starting from the scratch, the last year is used in the optimization.
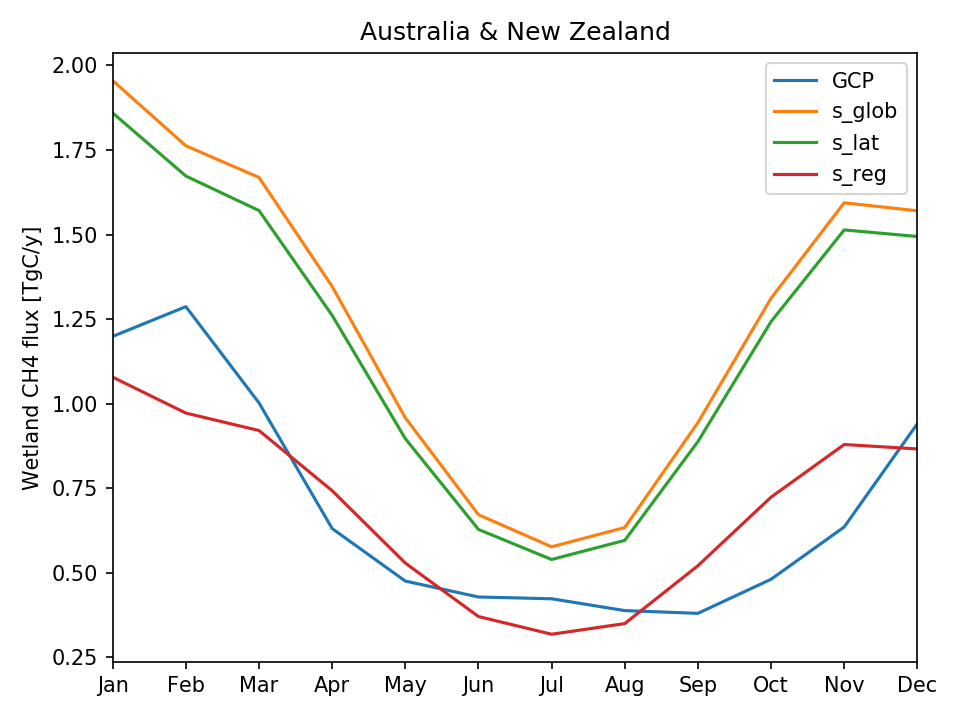
The optimization has been performed in three different ways:
The resulting S values are shown below:
| Region | Posterior value |
| Global | 0.00333 |
| North (>25N) | 0.00422 |
| Tropics (25N-25S) | 0.00301 |
| South (<25S) | 0.00326 |
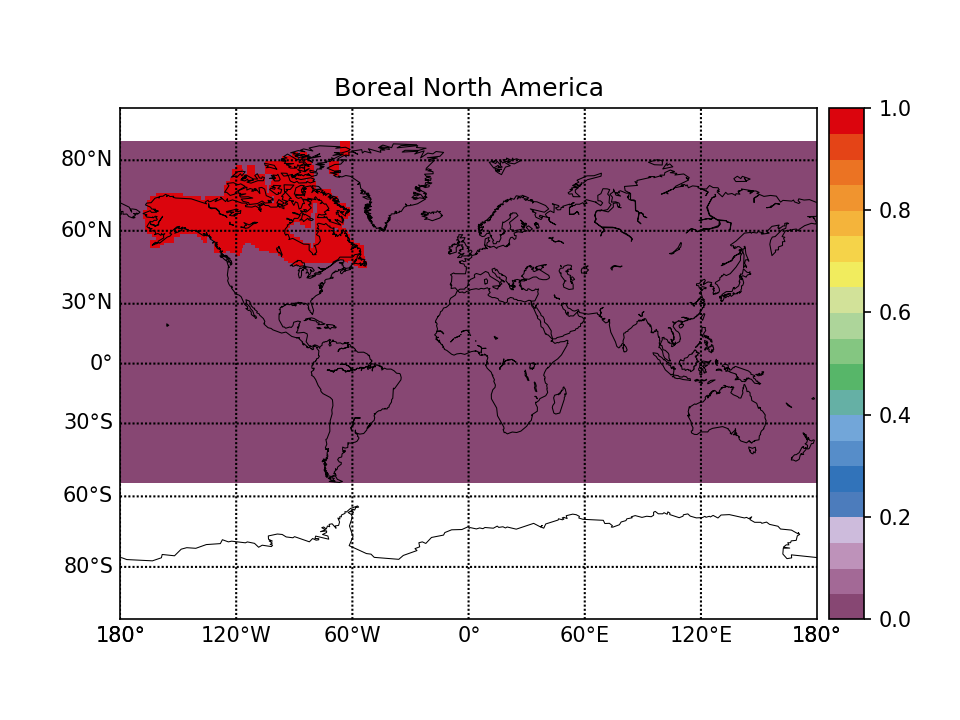
| Boreal North America | 0.00612 |
| Temperate North America | 0.00468 |
| Tropical South America | 0.00232 |
| Temperate South America | 0.00637 |
| Europe | 0.00238 |
| Boreal Asia | 0.00736 |
| Temperate Asia | 0.00325 |
| Tropical Asia | 0.00285 |
| North Africa | 0.00321 |
| South Africa | 0.00360 |
| Australia & New Zealand | 0.00183 |
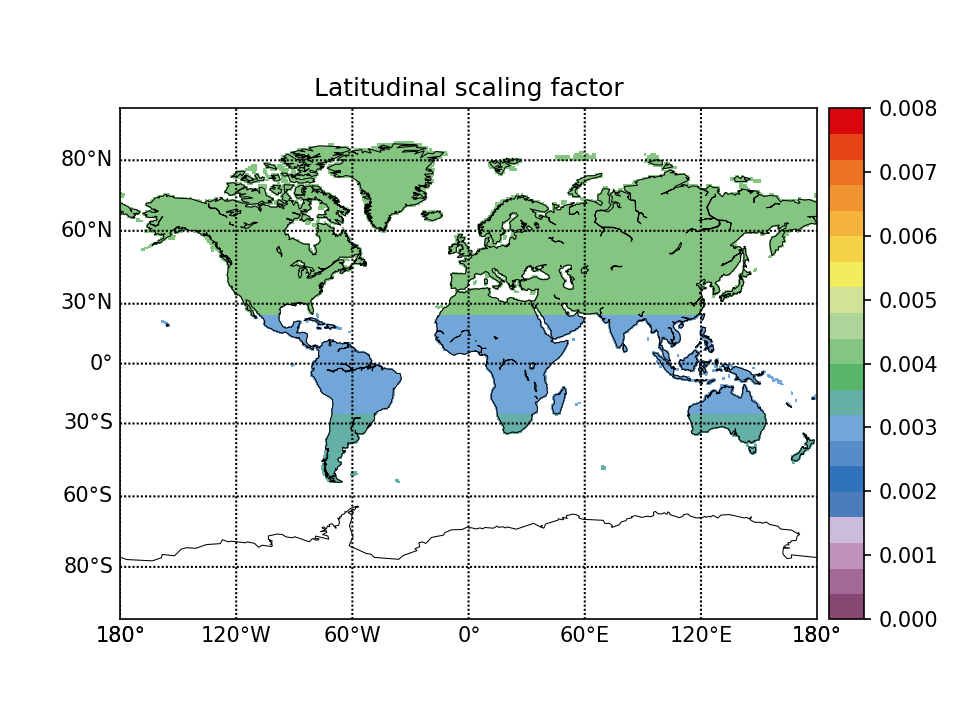
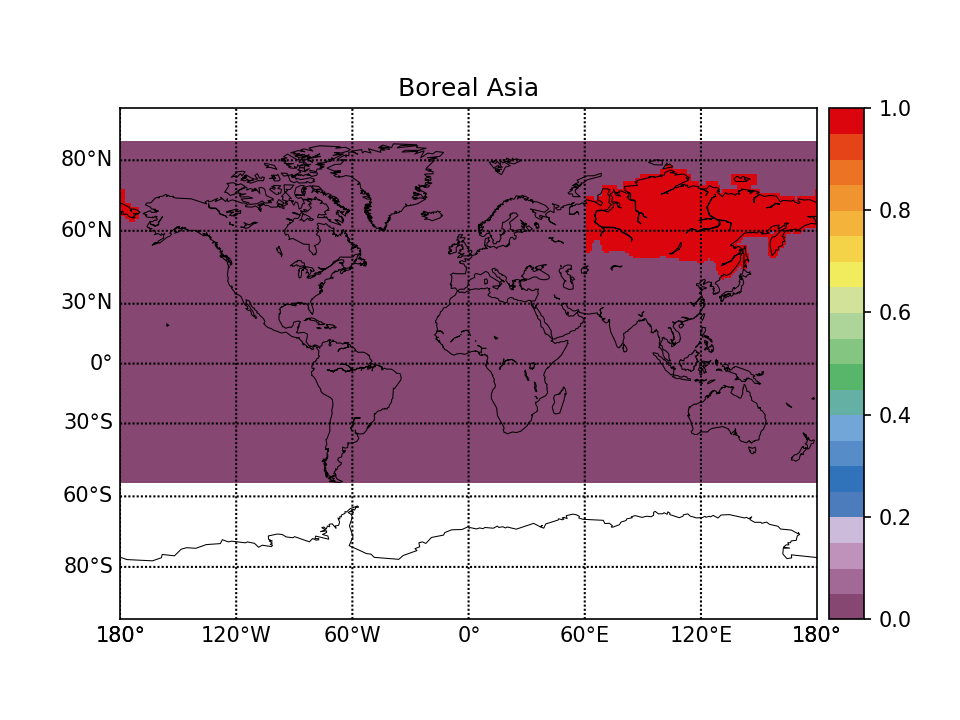
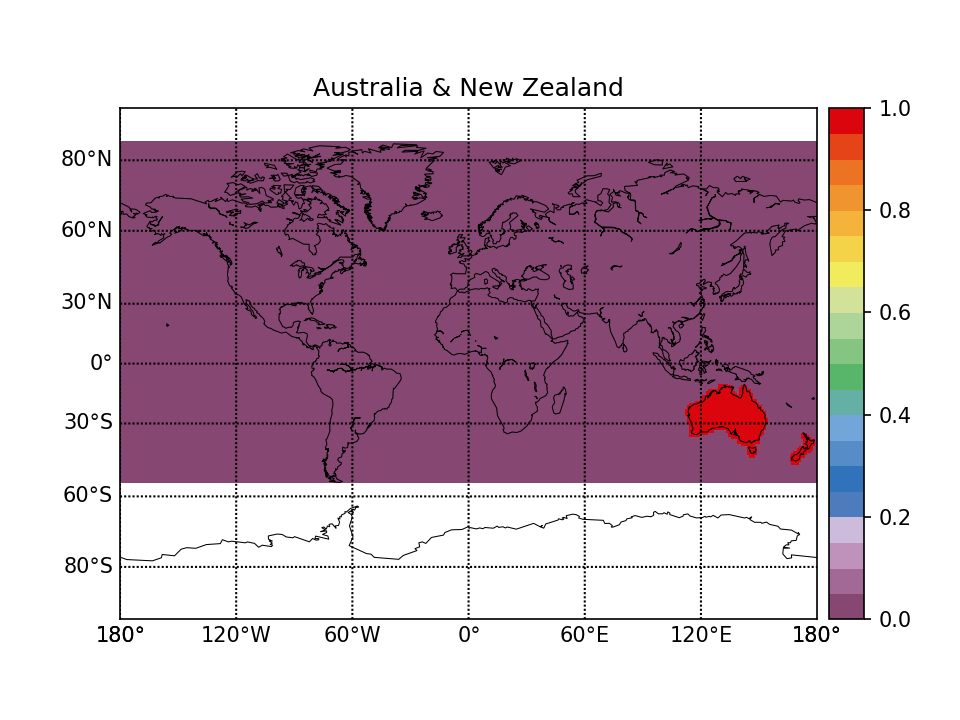
The latitudinal and regional maps for S are shown below.
The maps in netcdf format can be downloaded here:
 |
 |
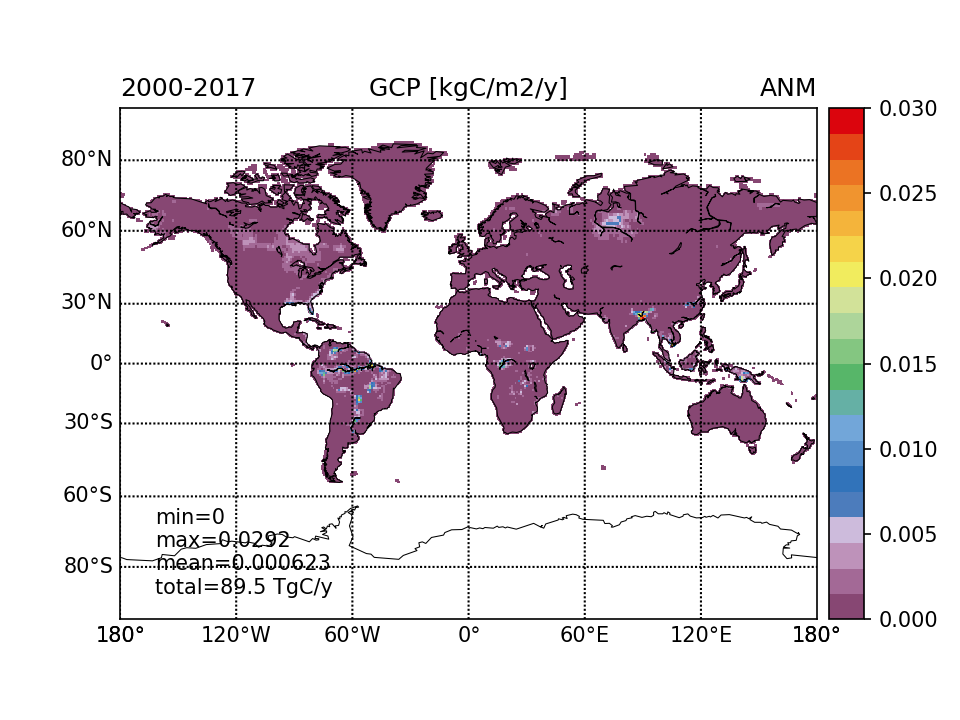
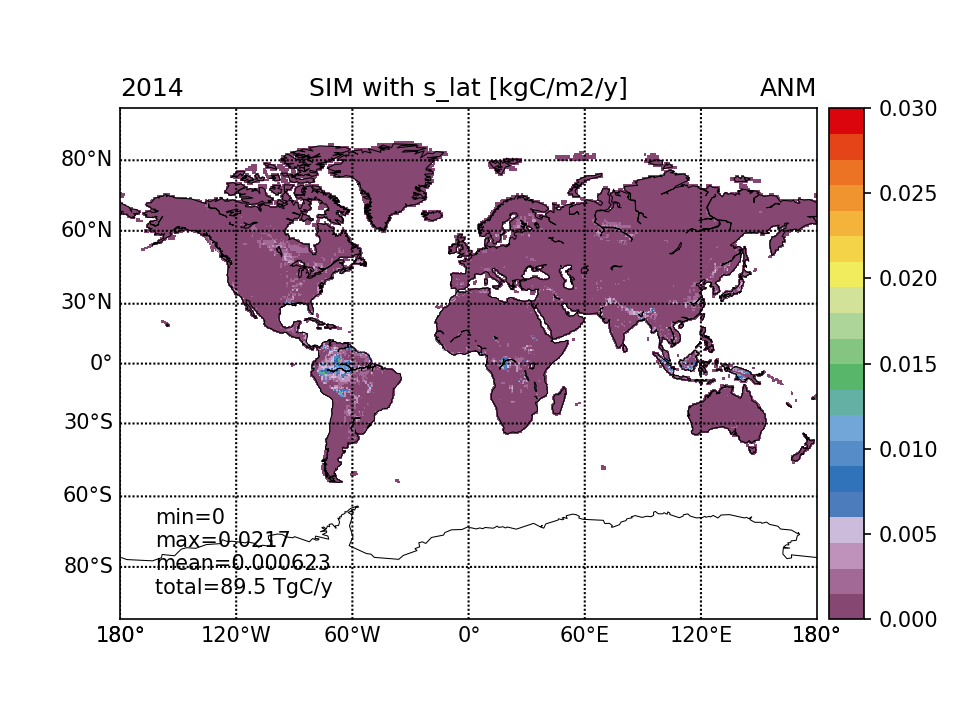
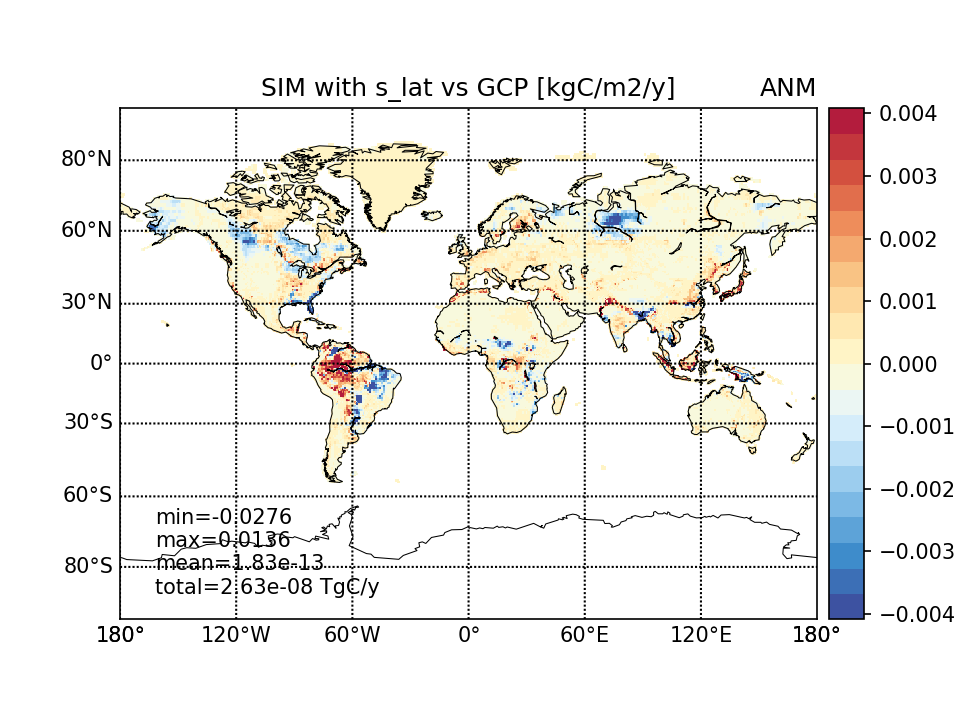
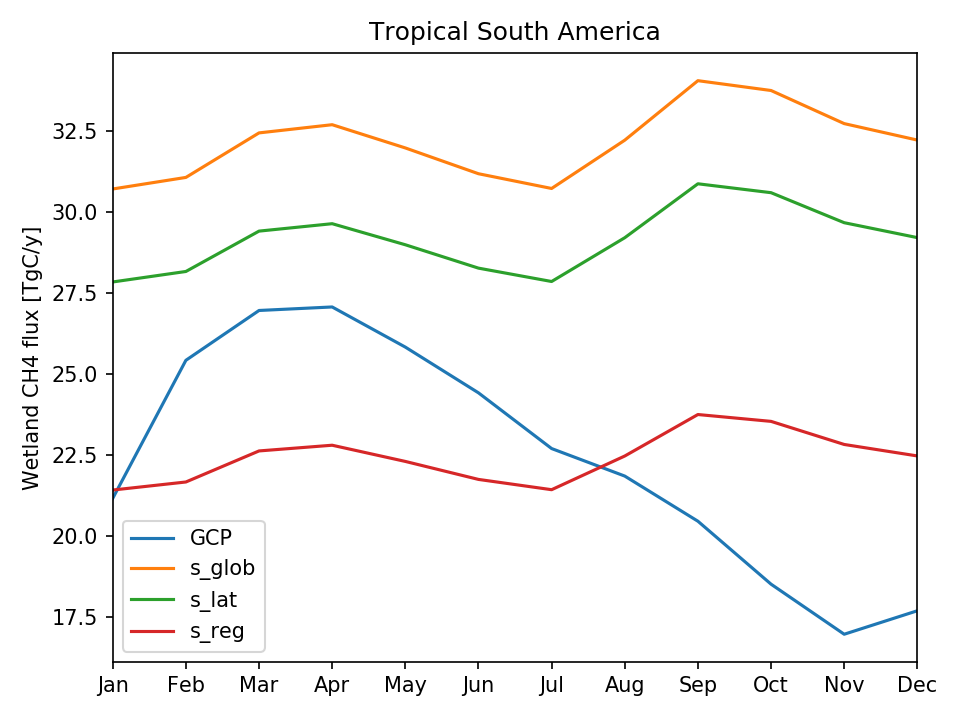
The resulting mean annual maps for observations (GCP products median), CTESSEL simulations obtained with different scaling factors and their differences are presented below:
 |
 |
 |
 |
 |
 |
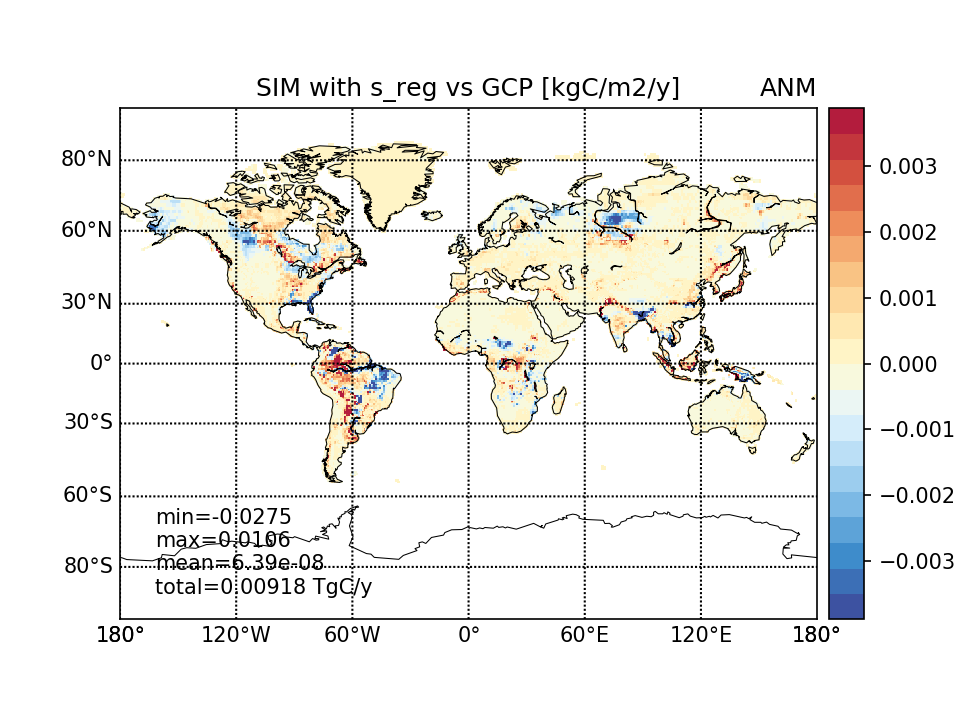 |
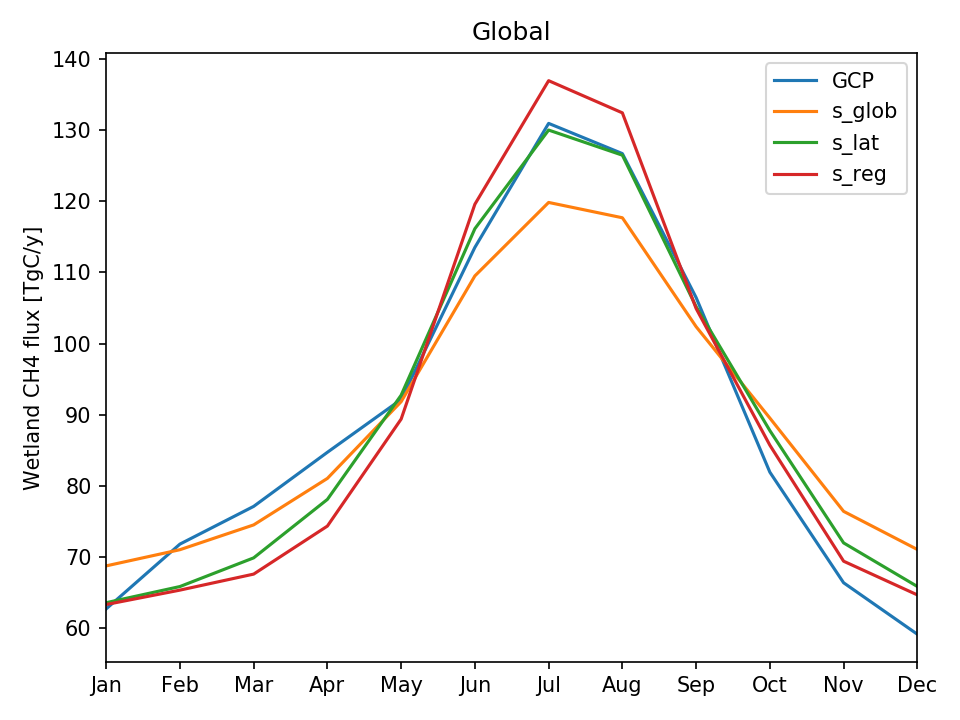
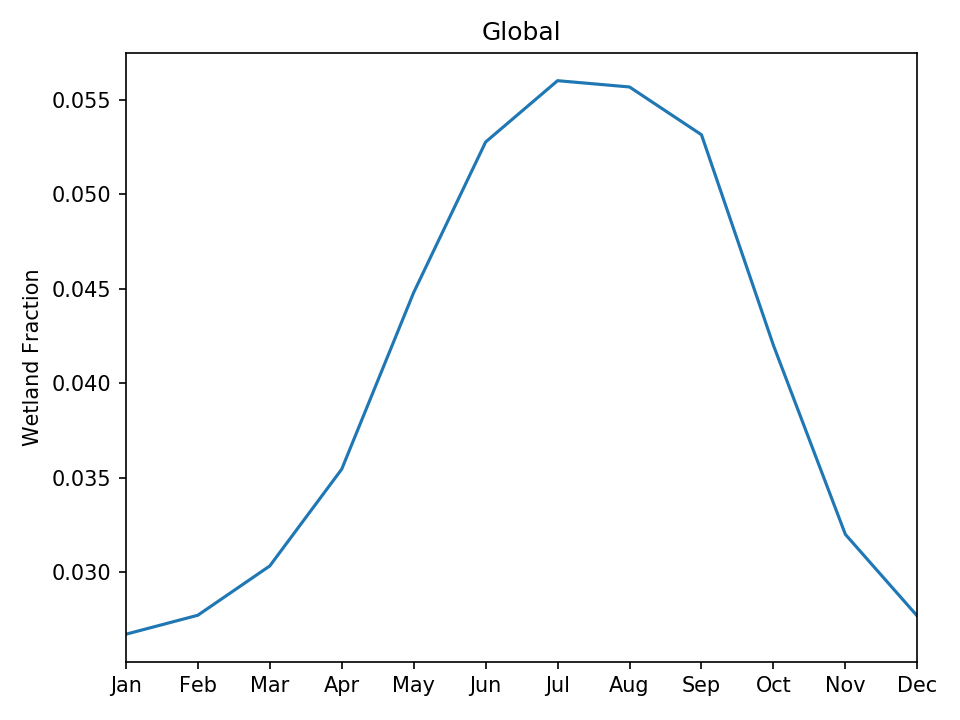
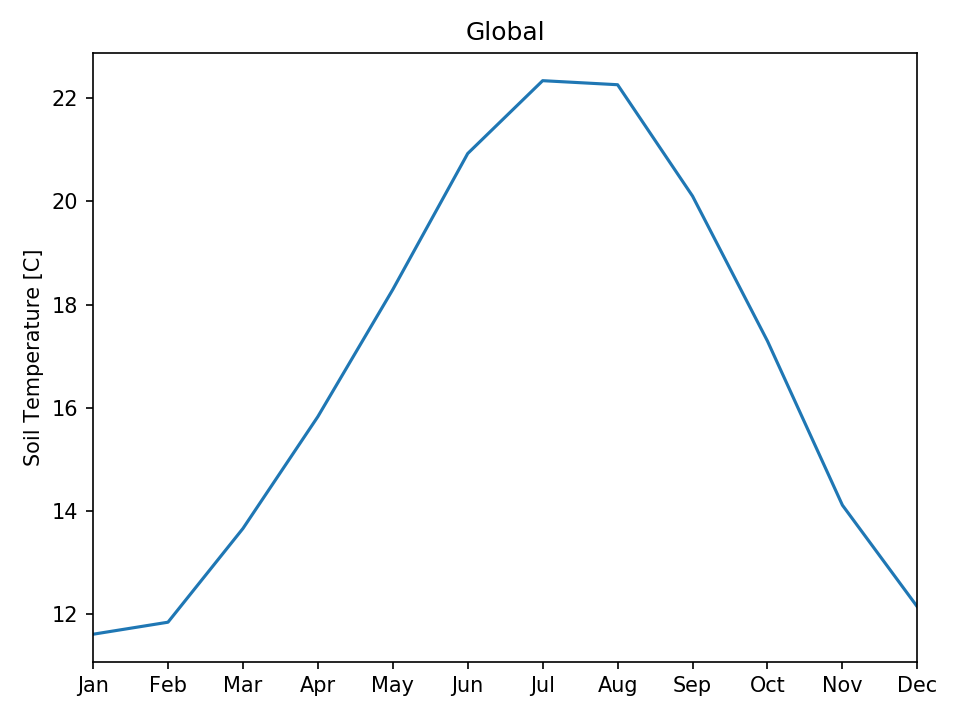
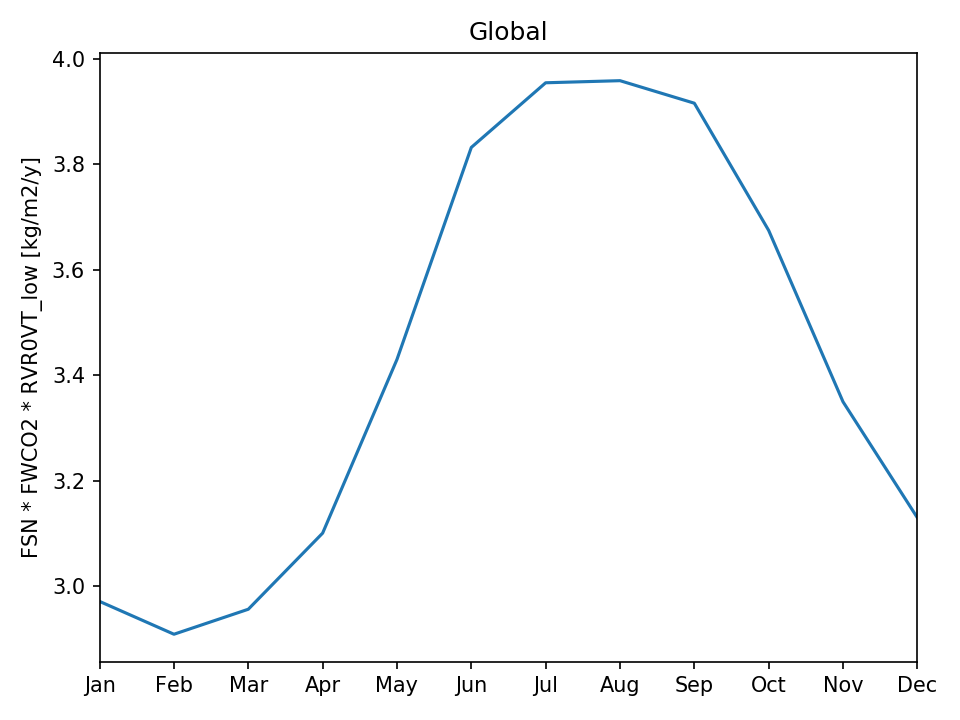
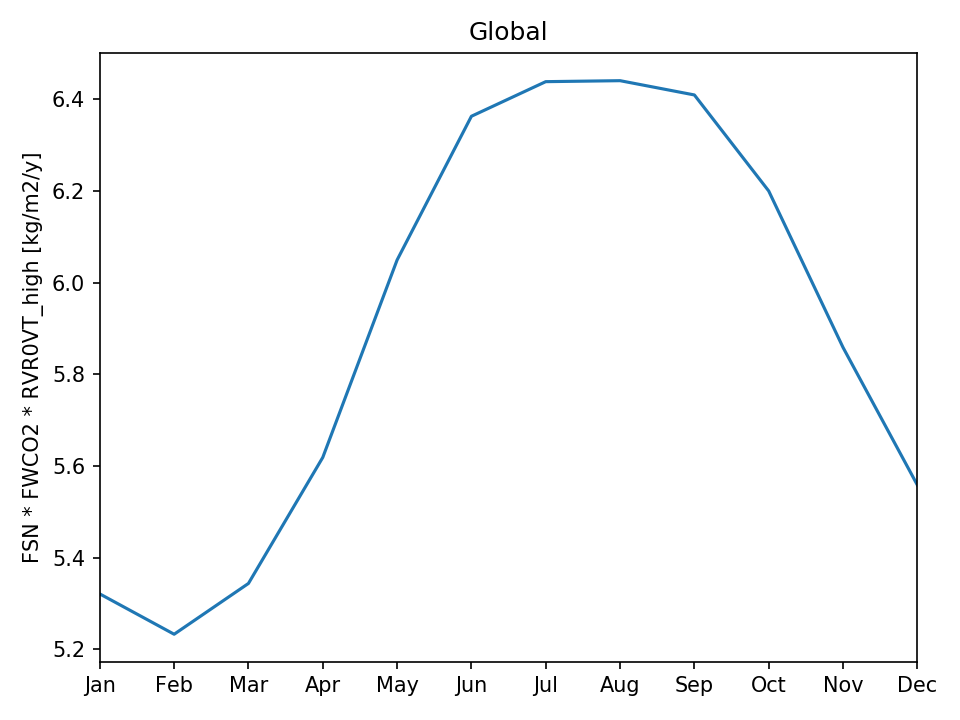
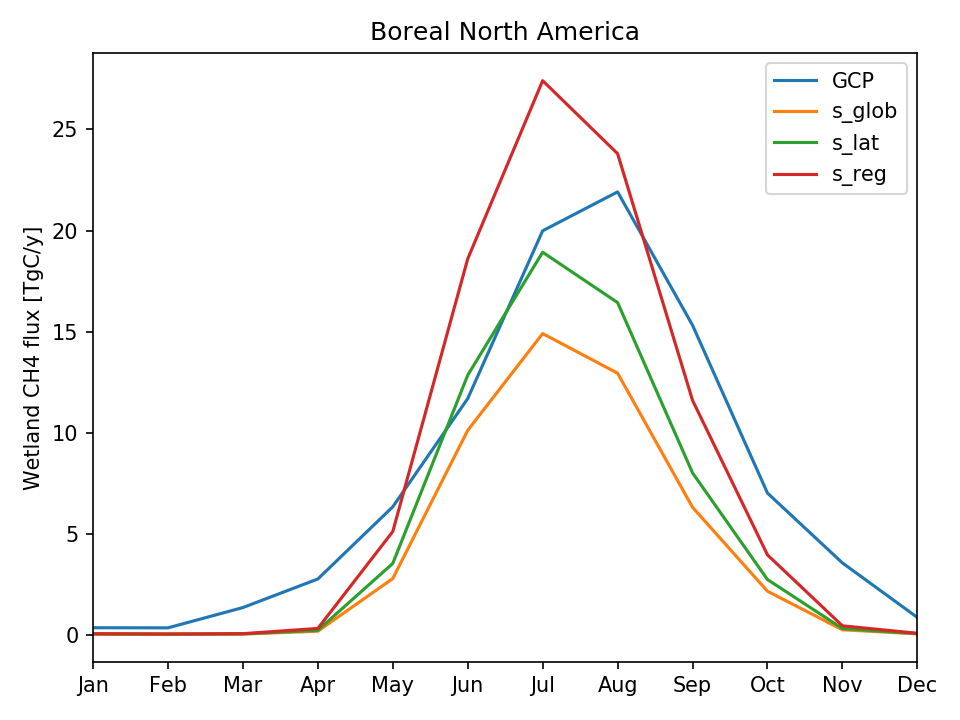
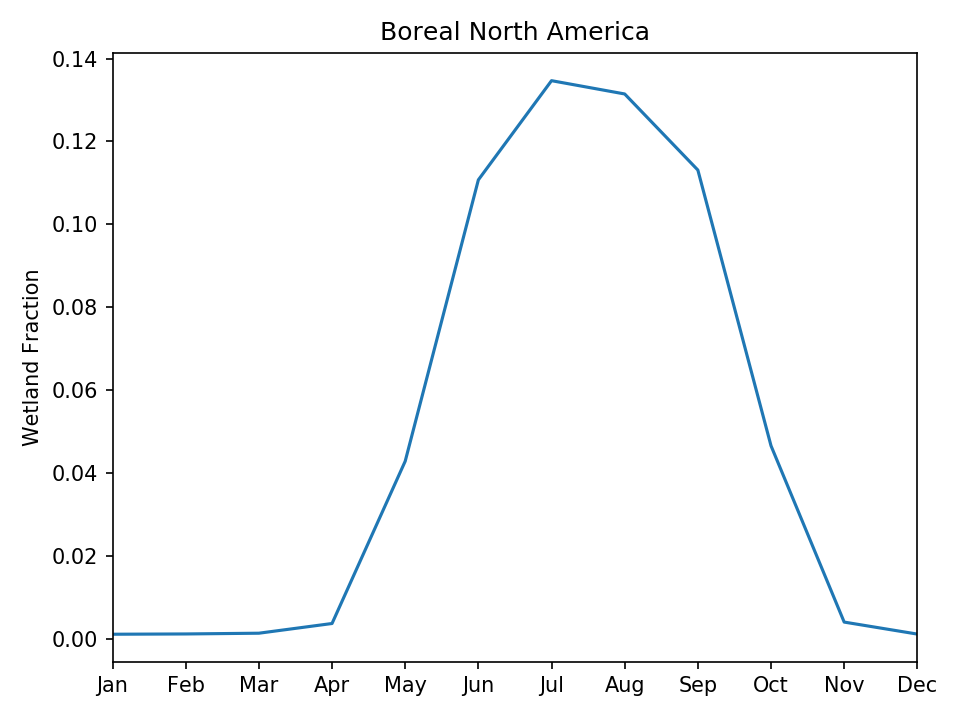
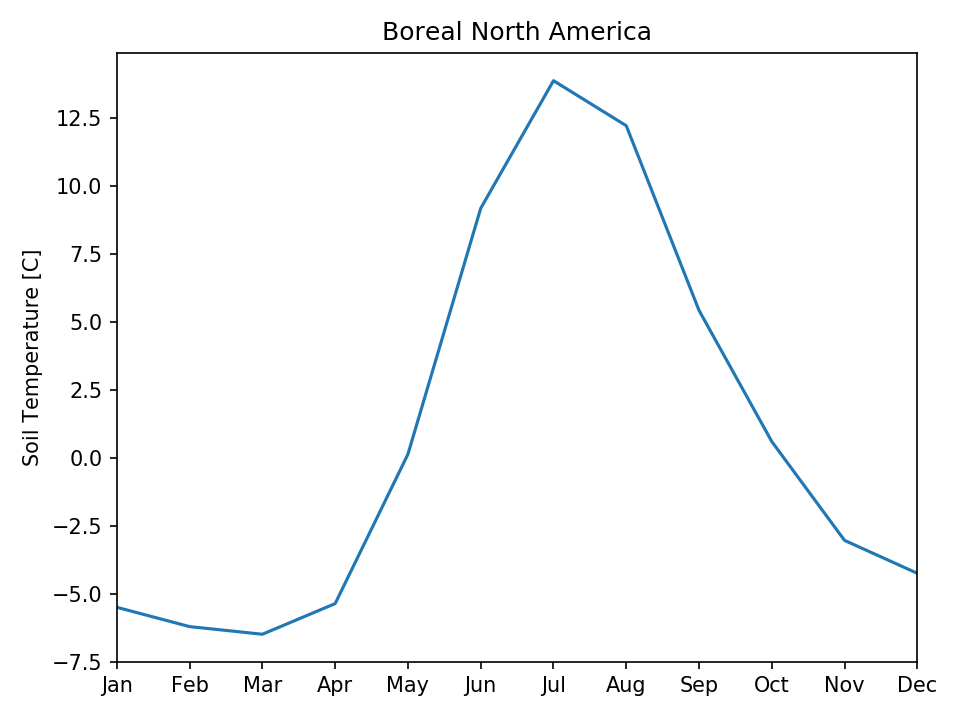
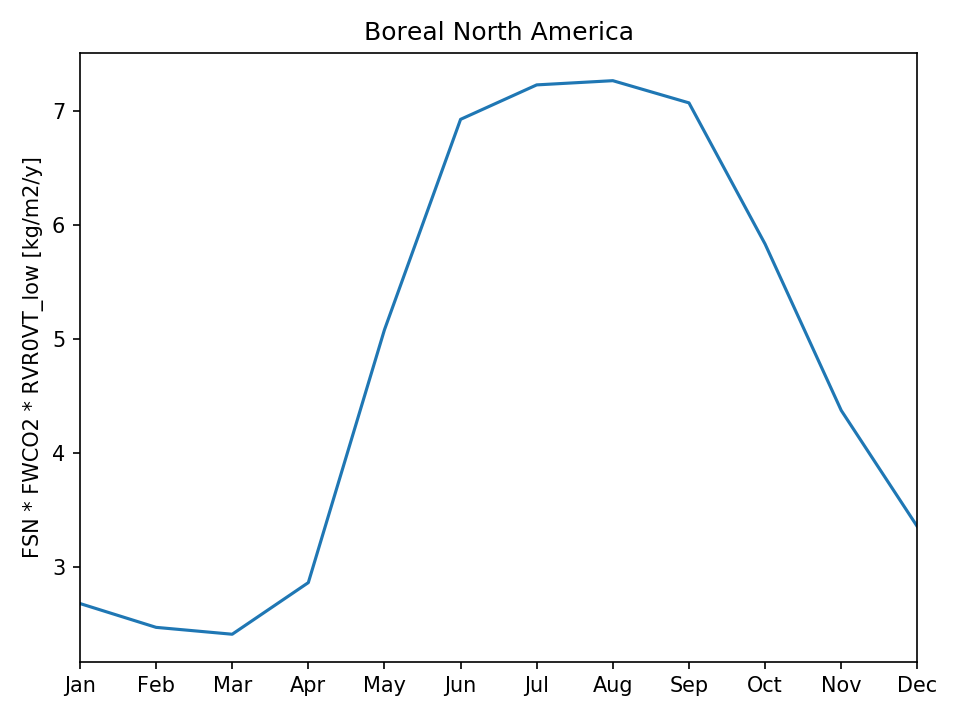
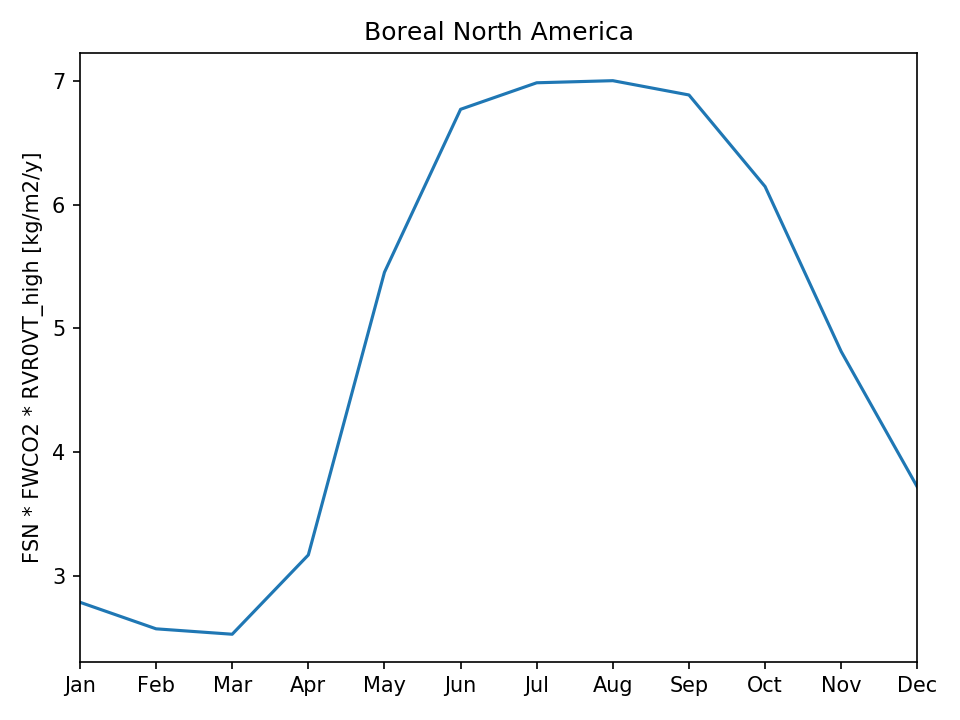
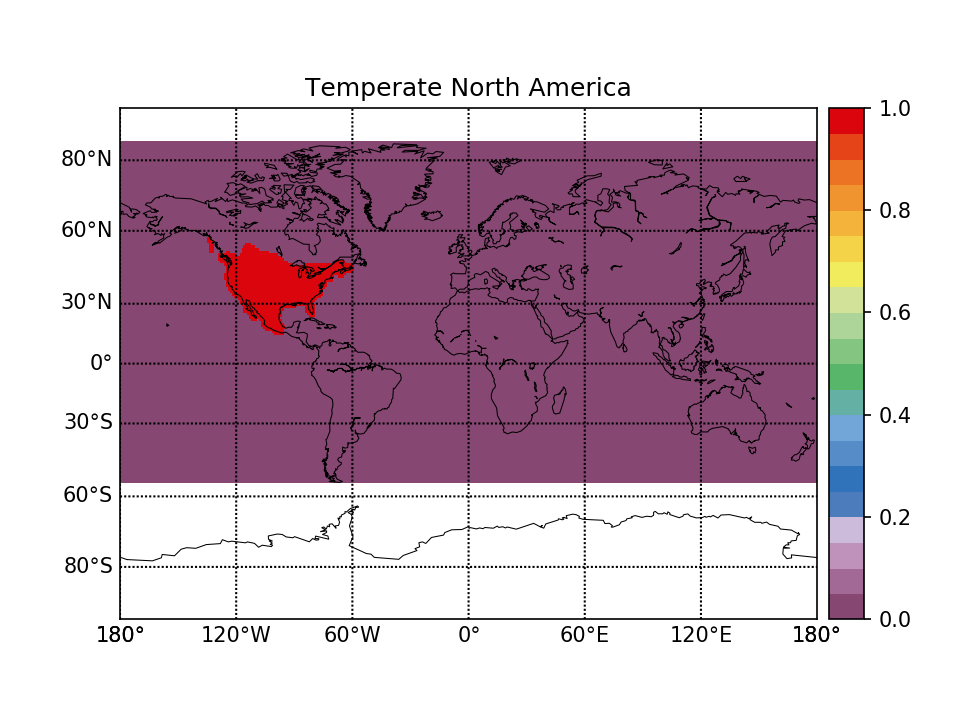
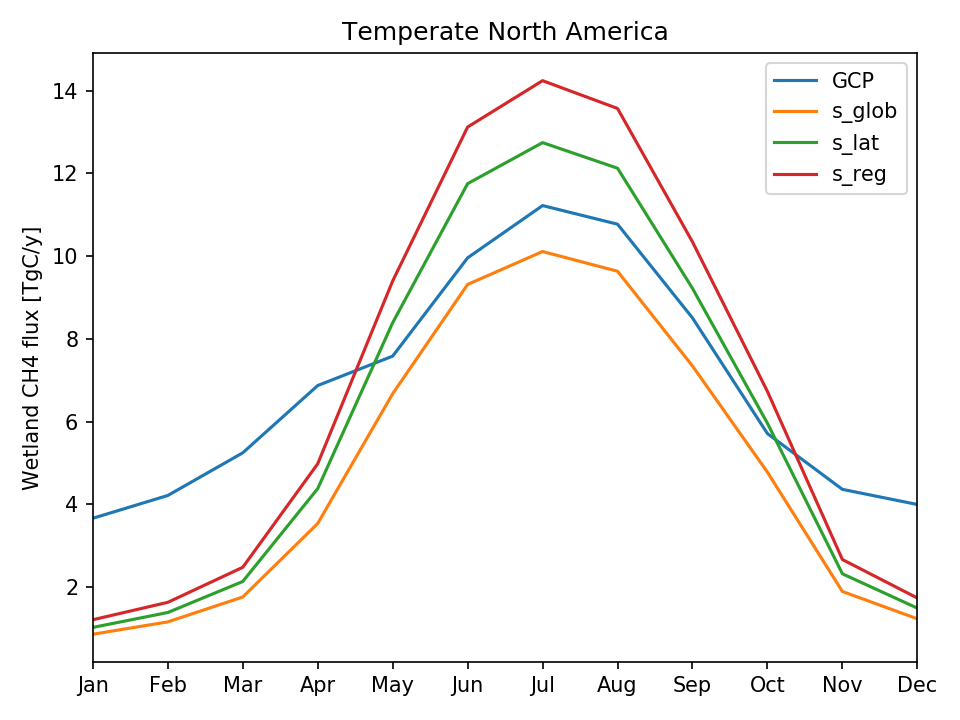
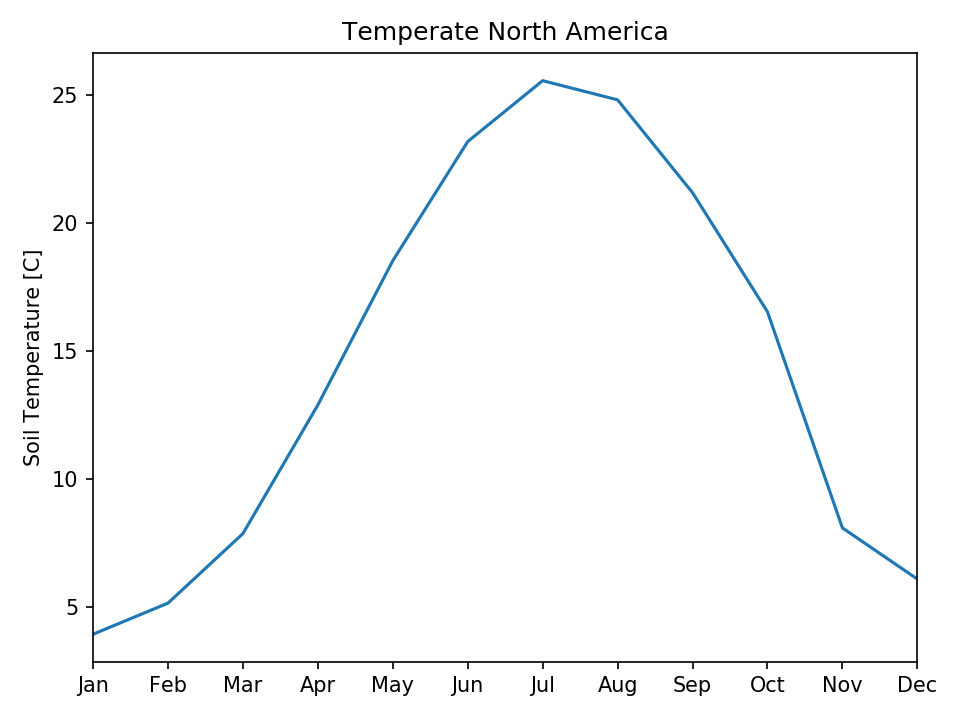
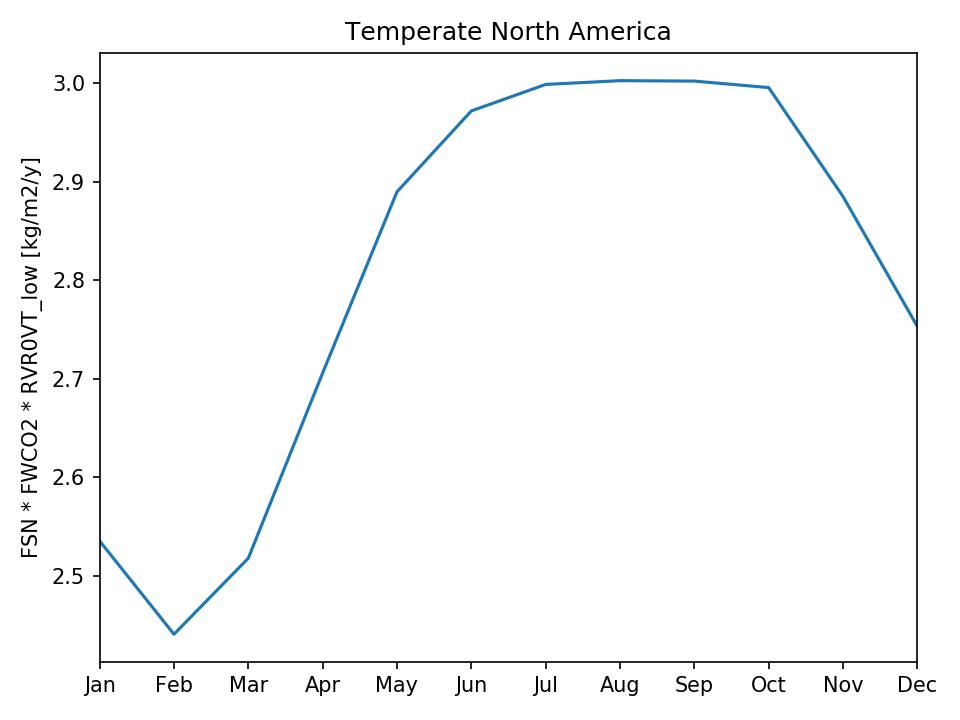
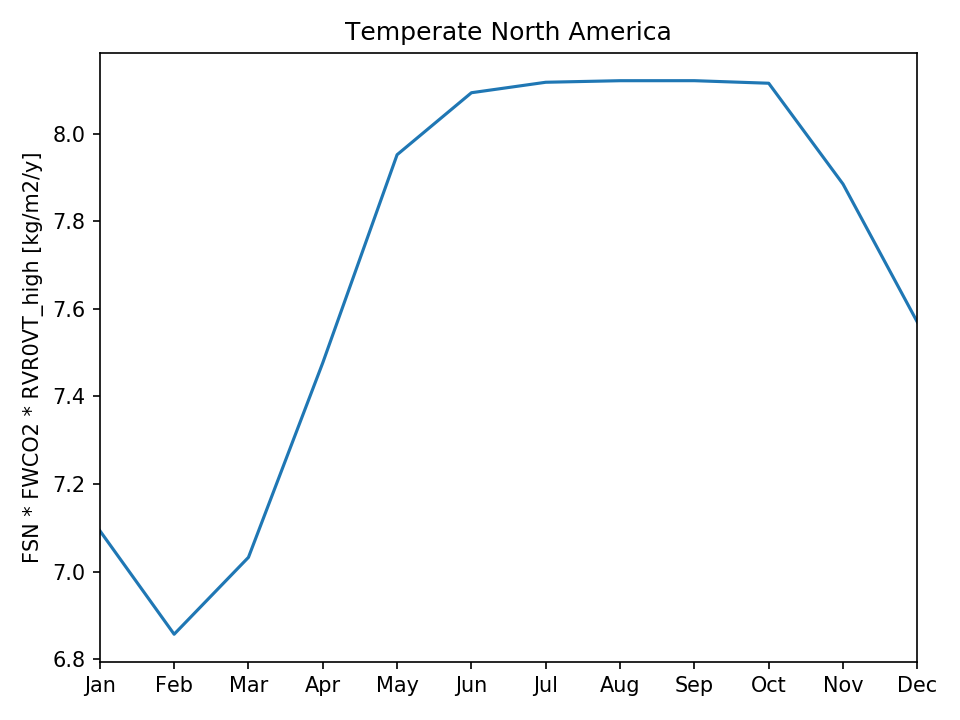
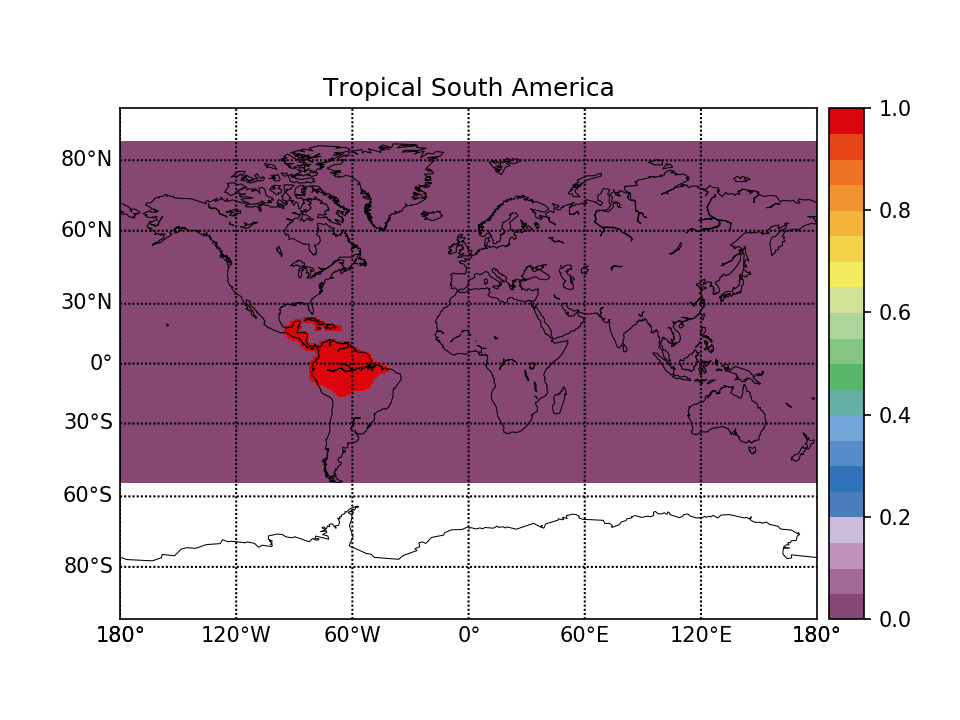
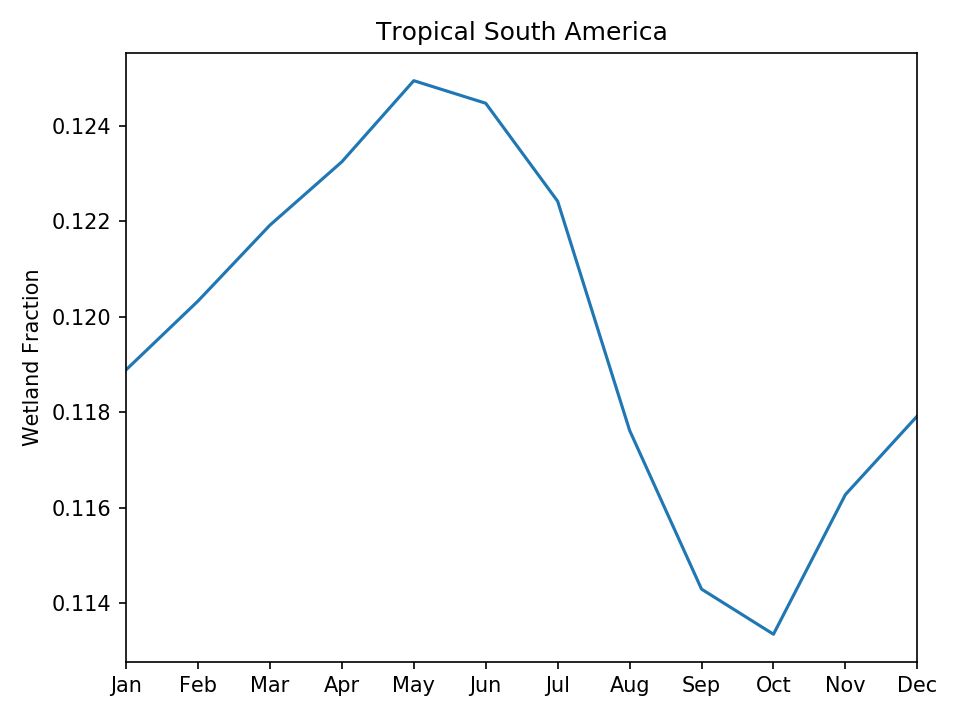
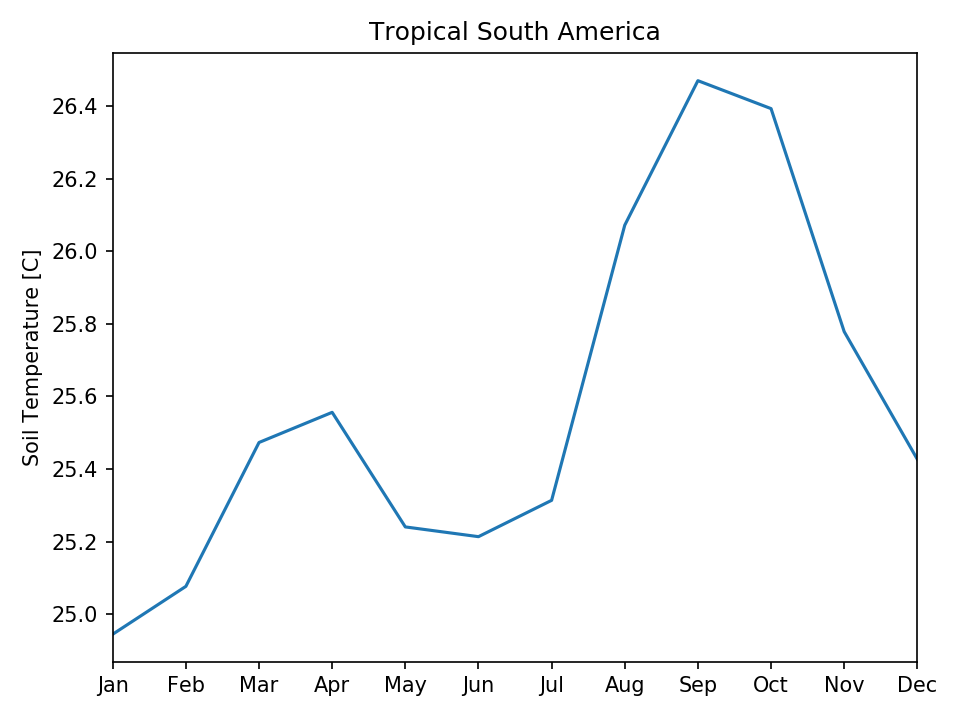
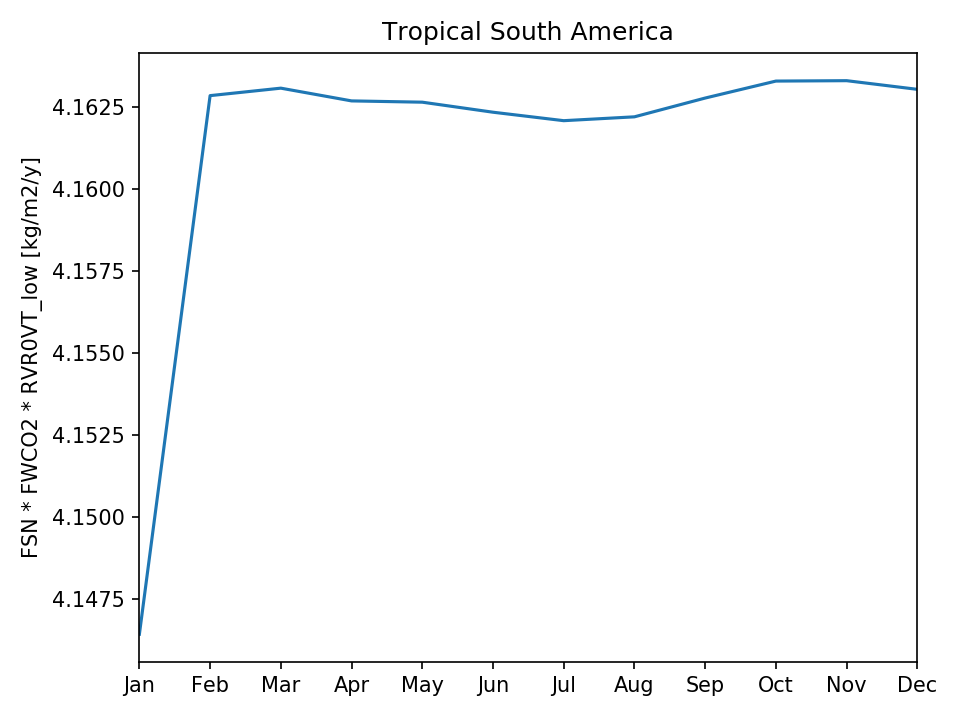
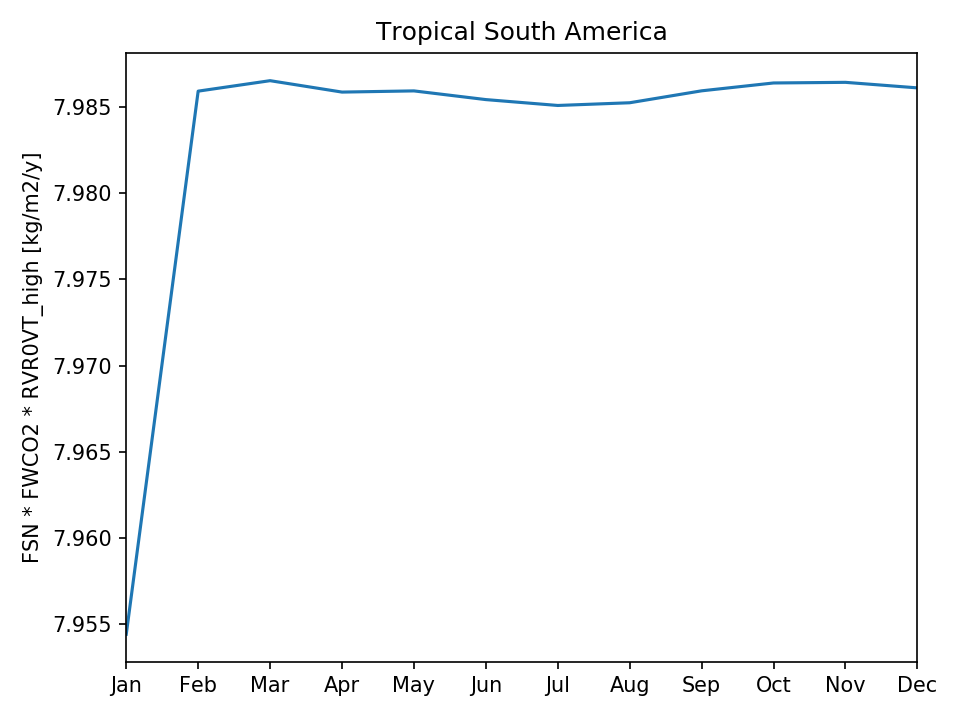
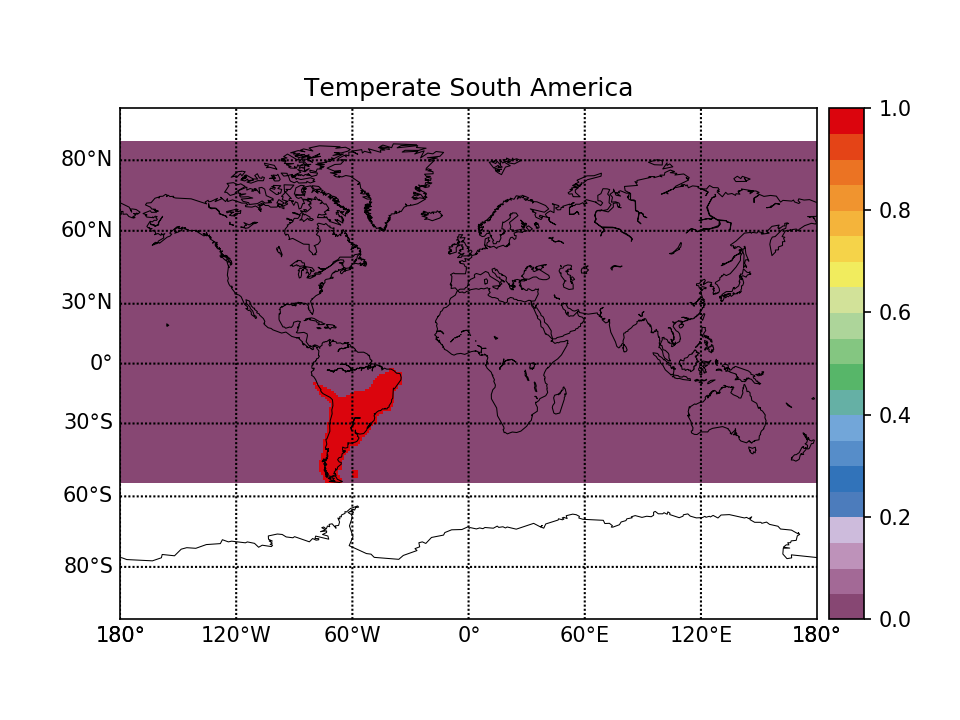
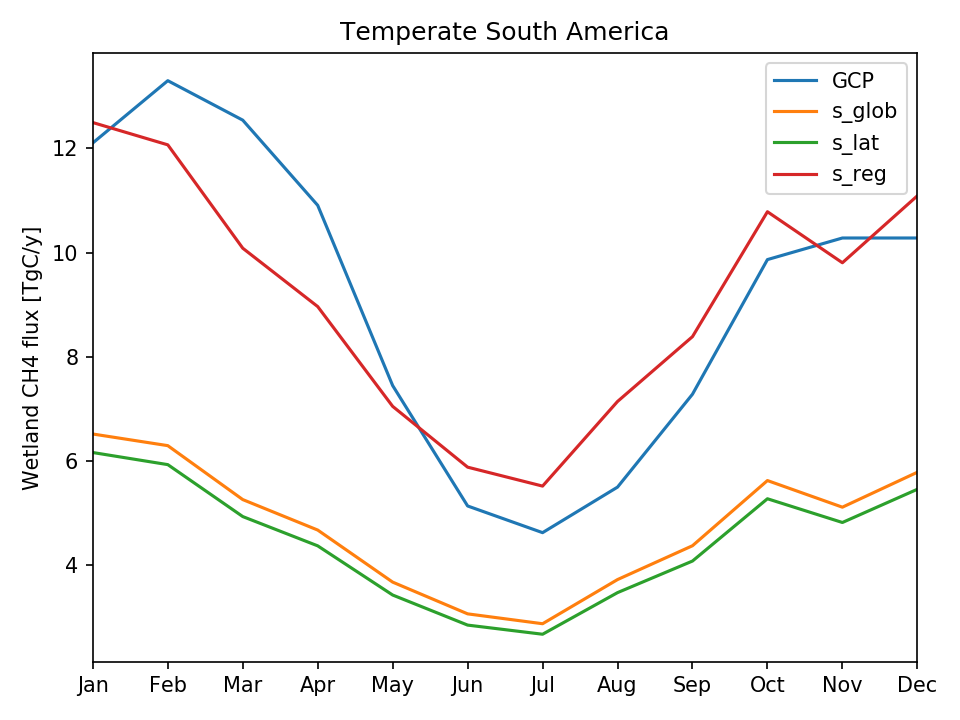
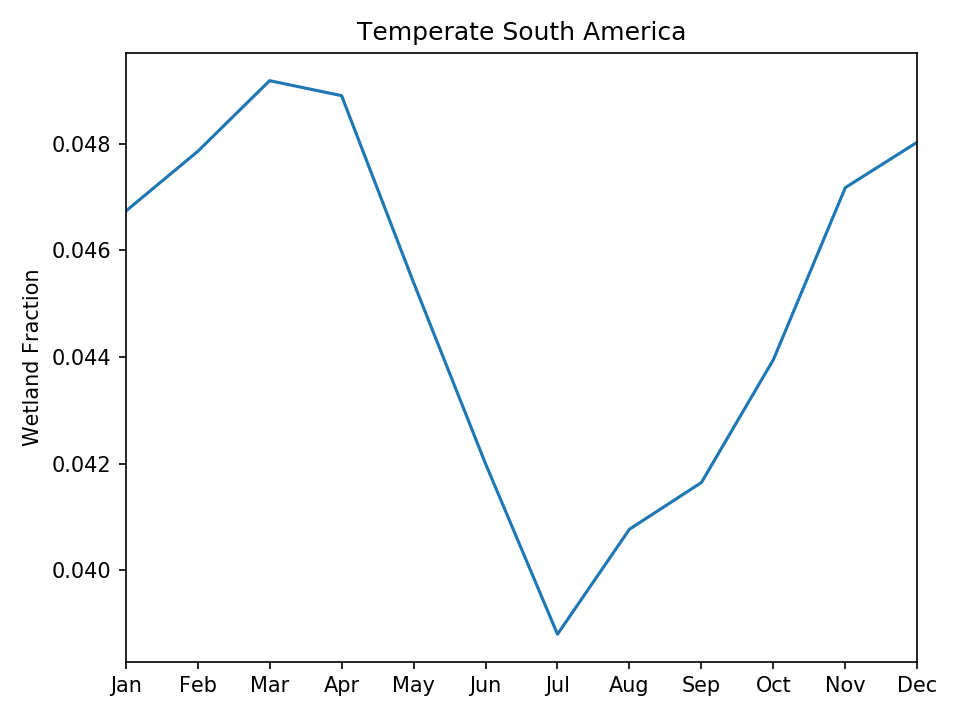
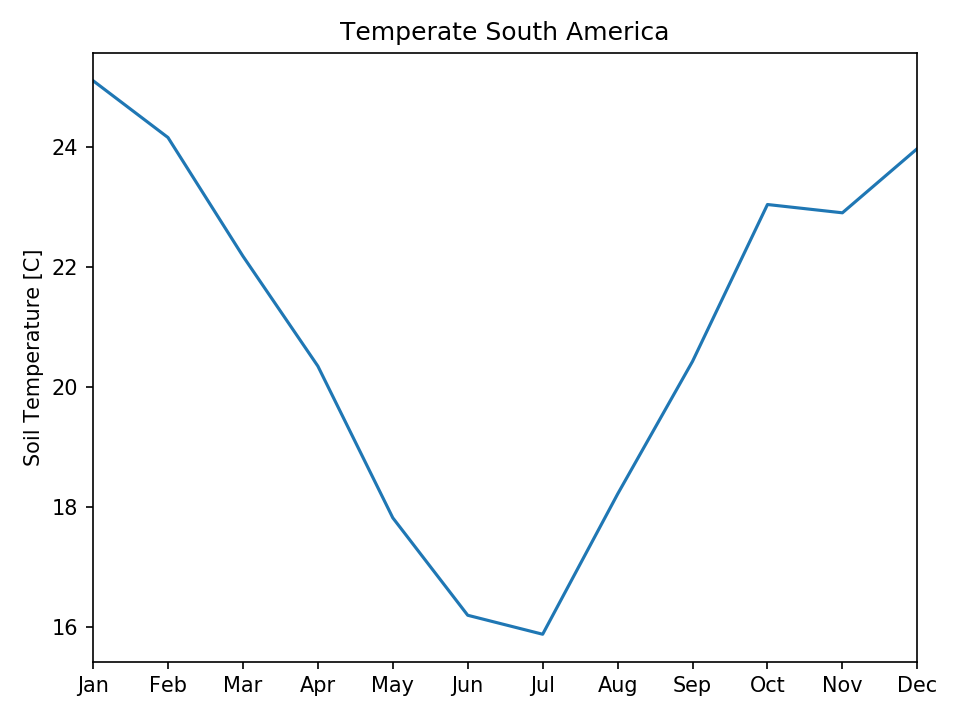
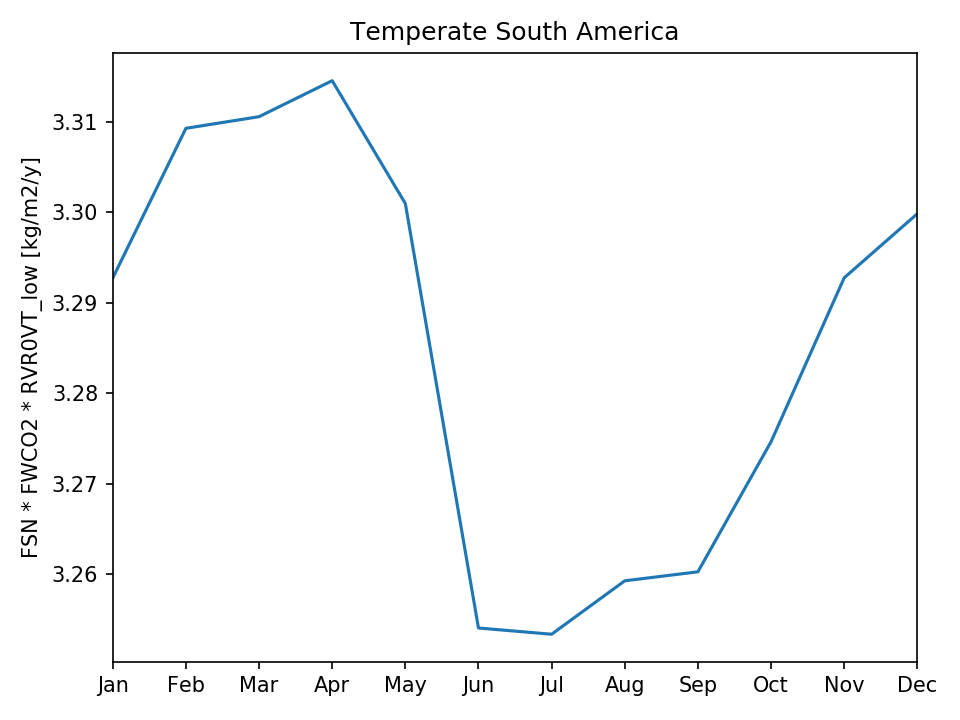
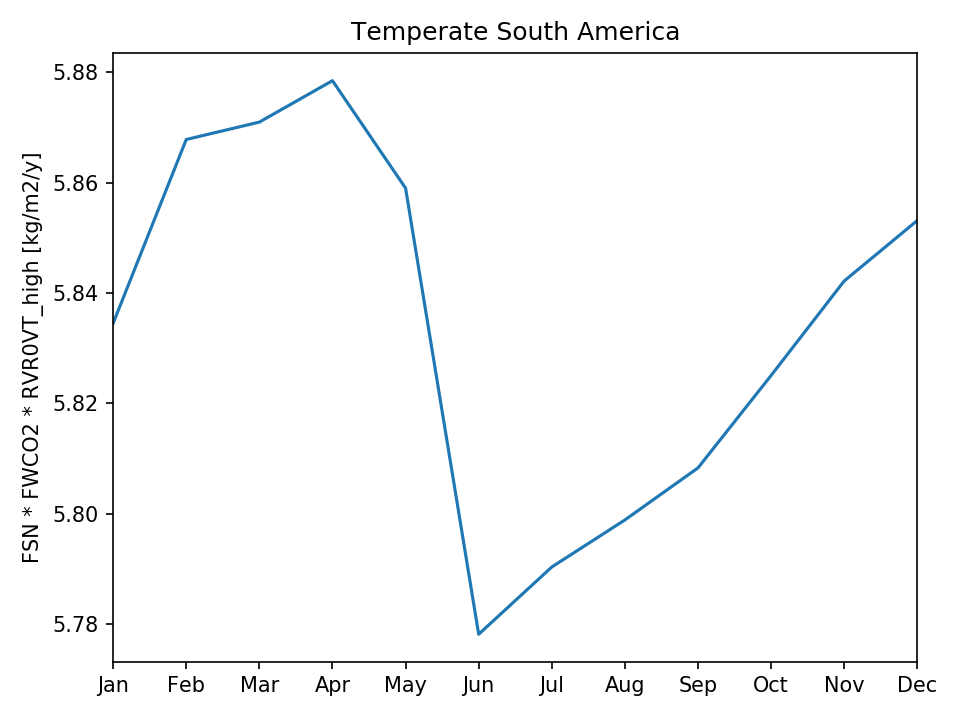
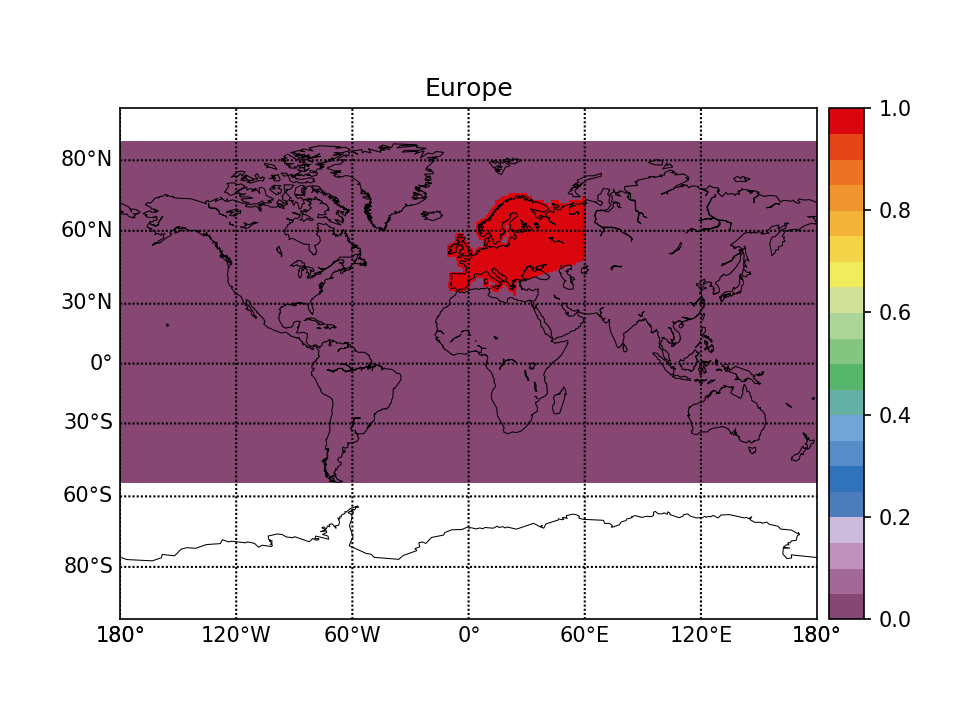
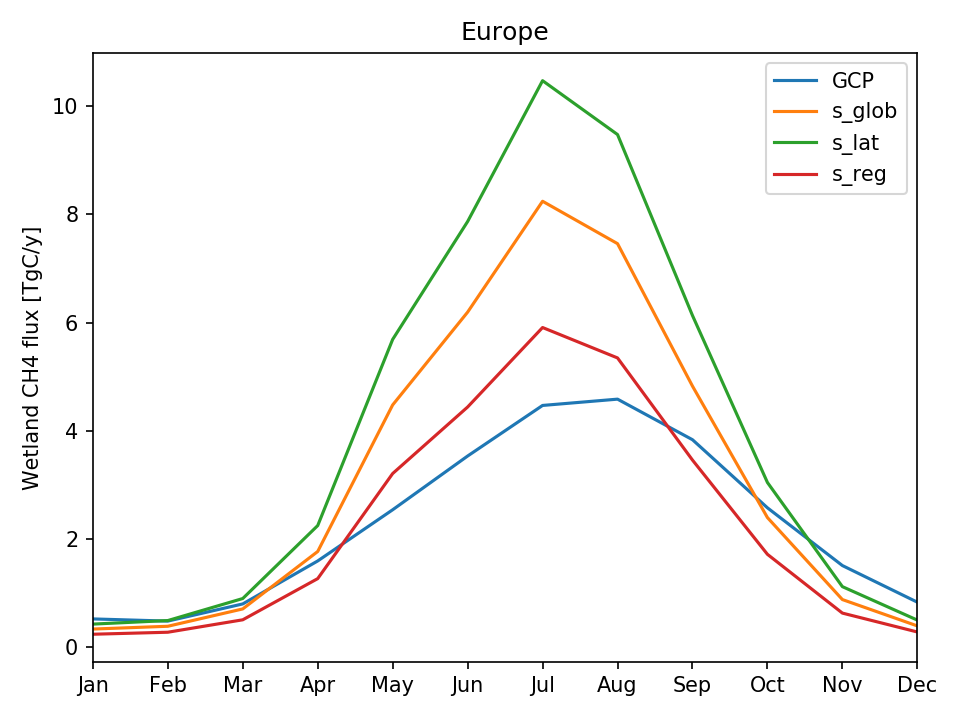
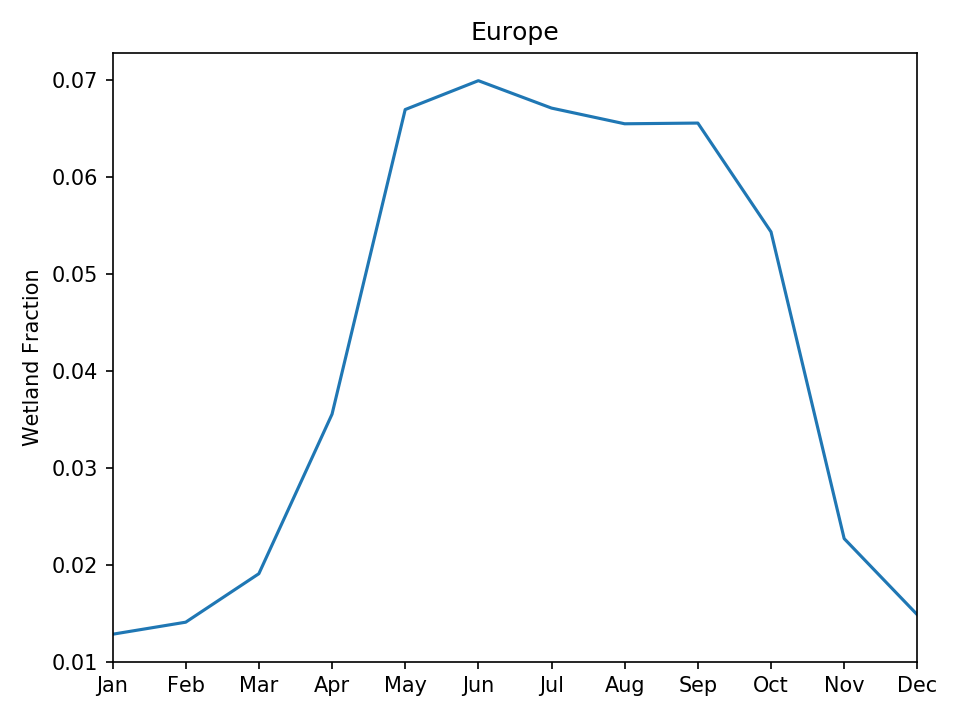
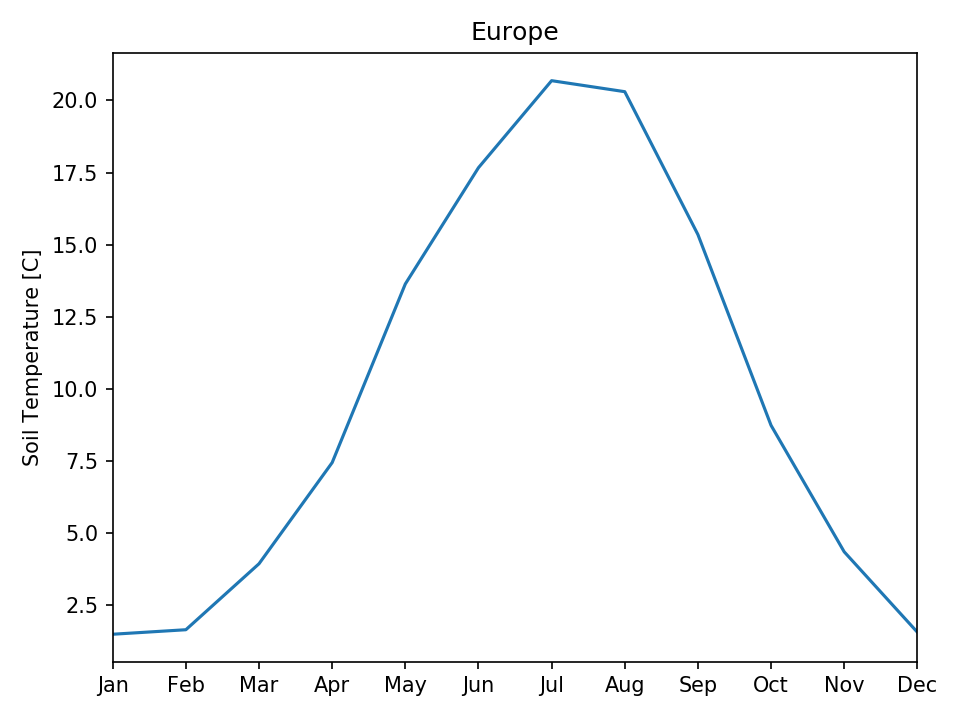
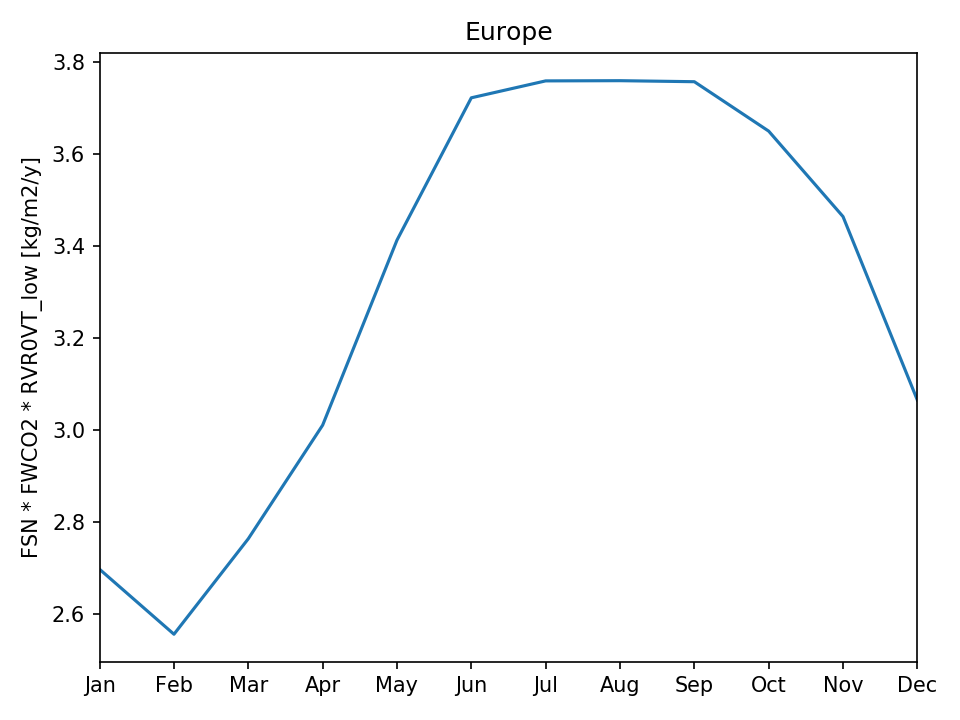
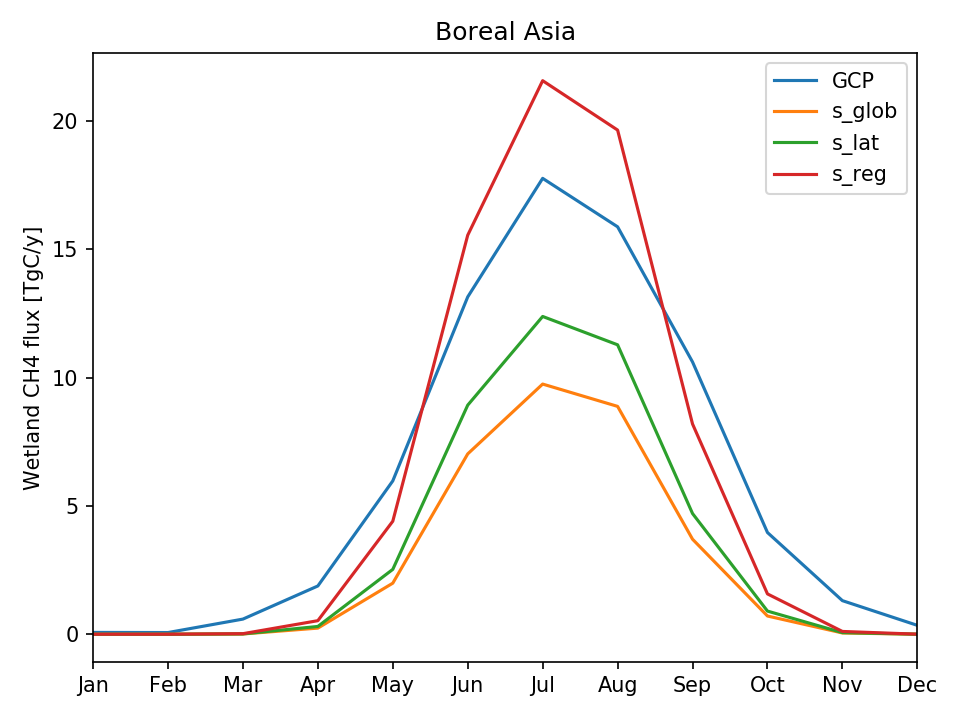
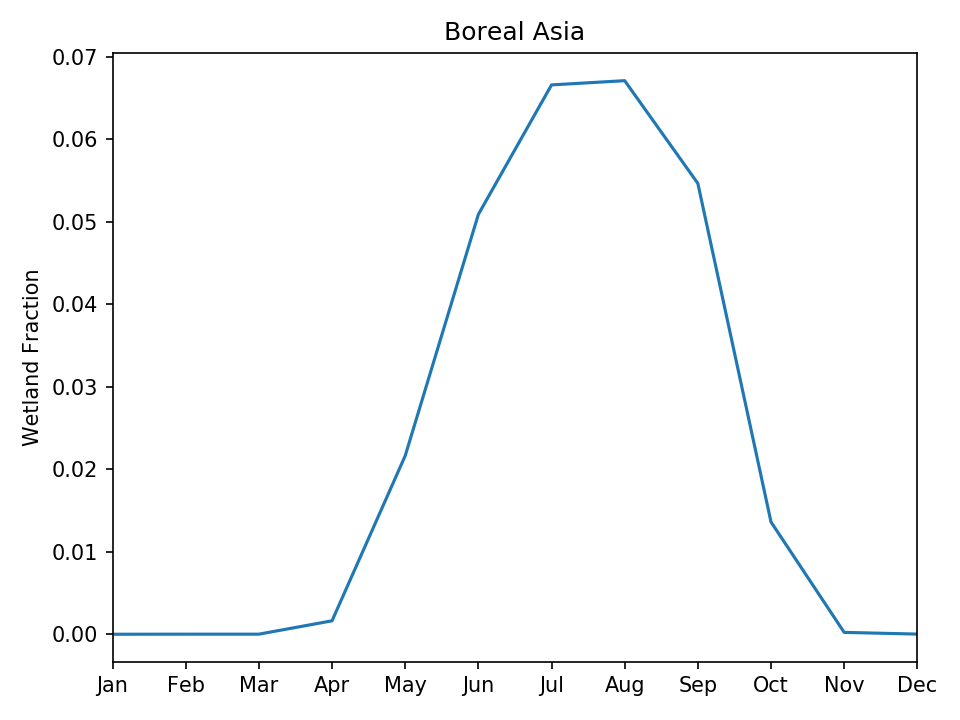
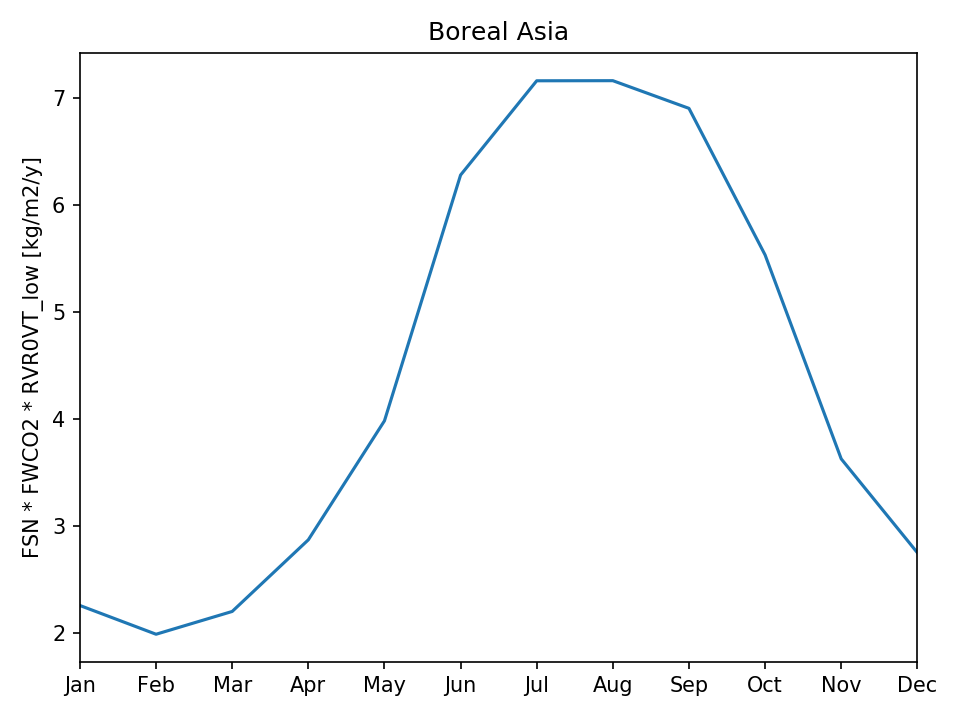
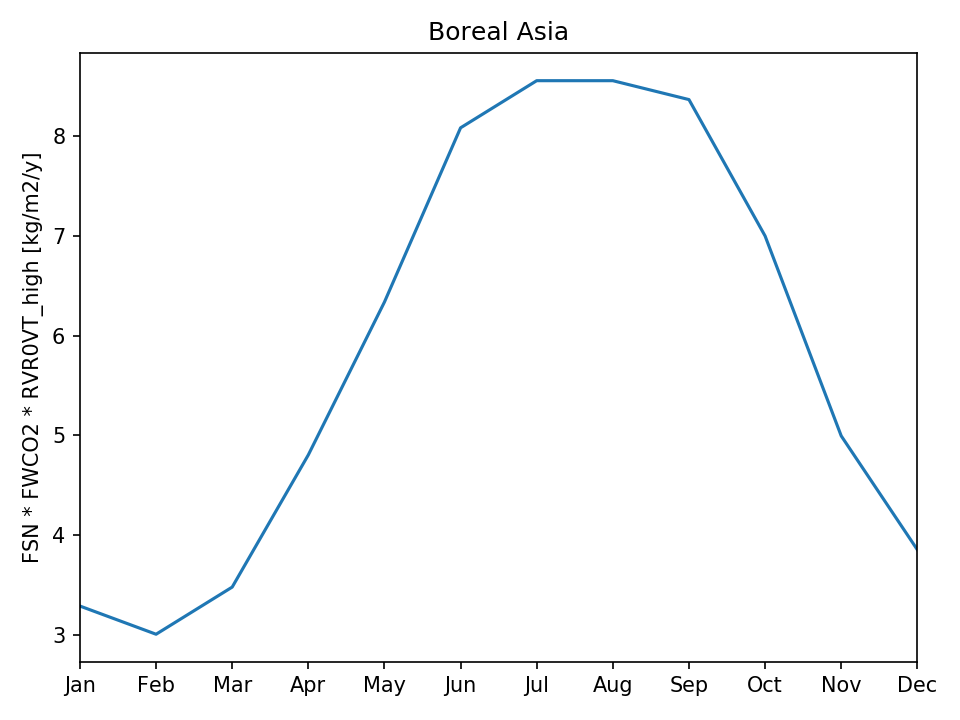
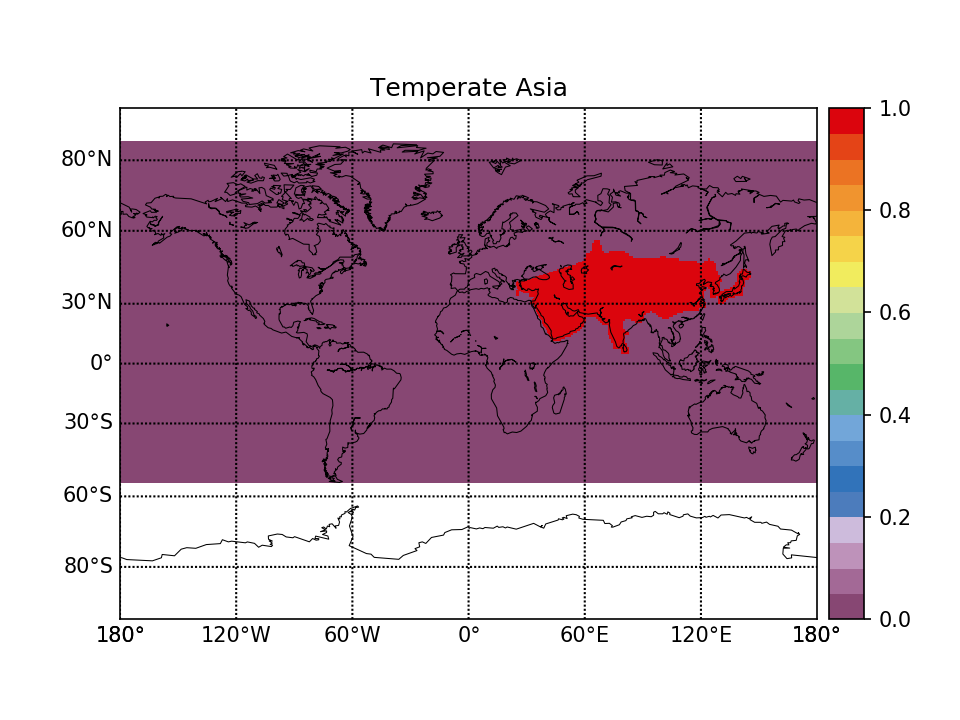
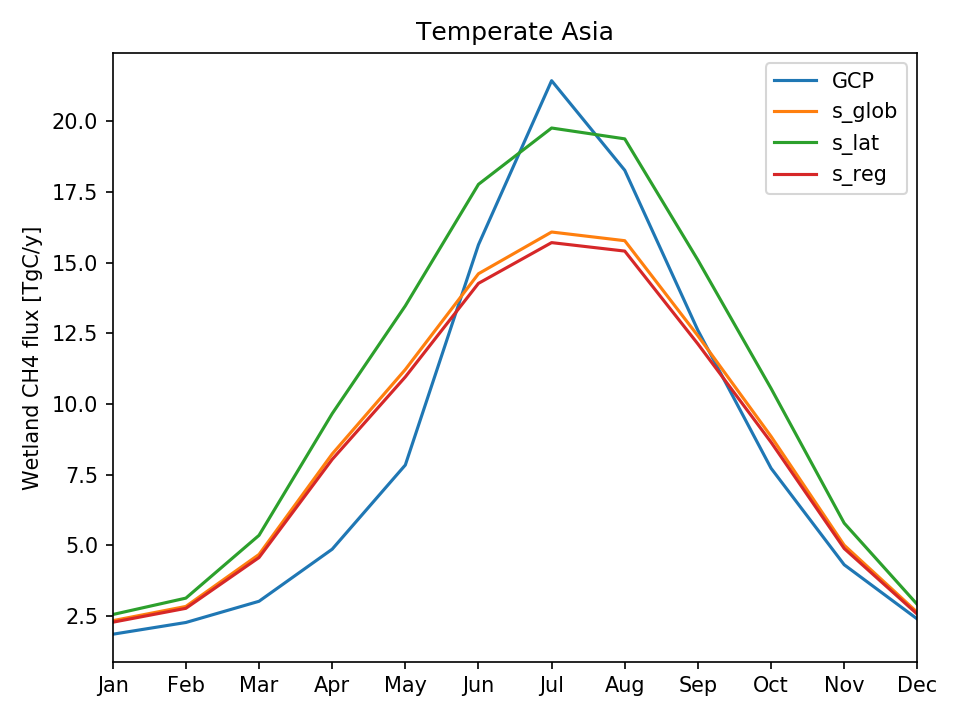
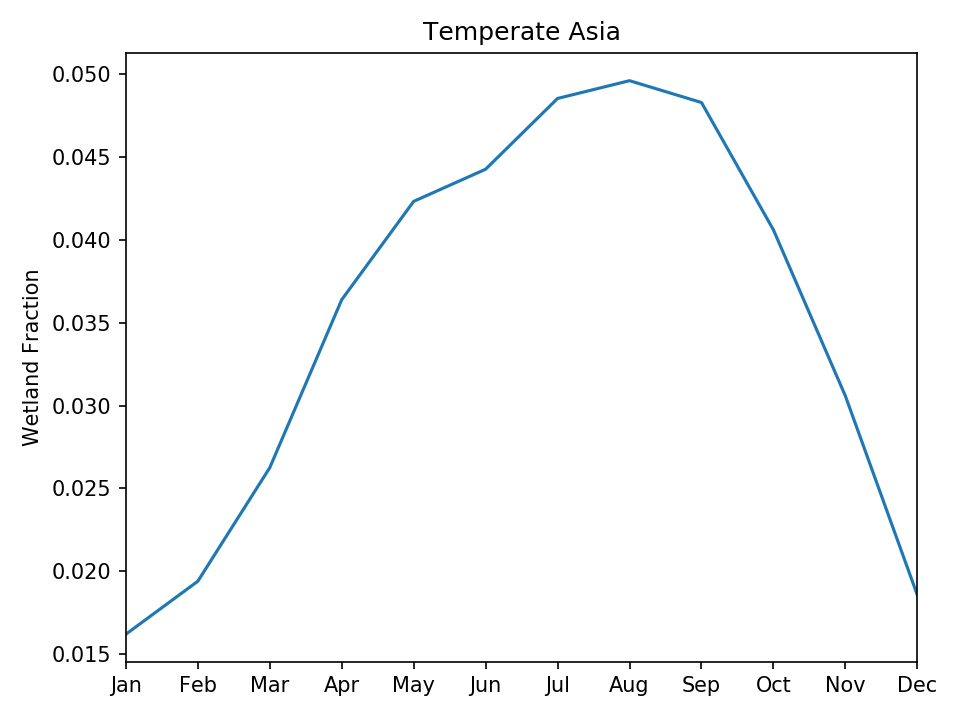
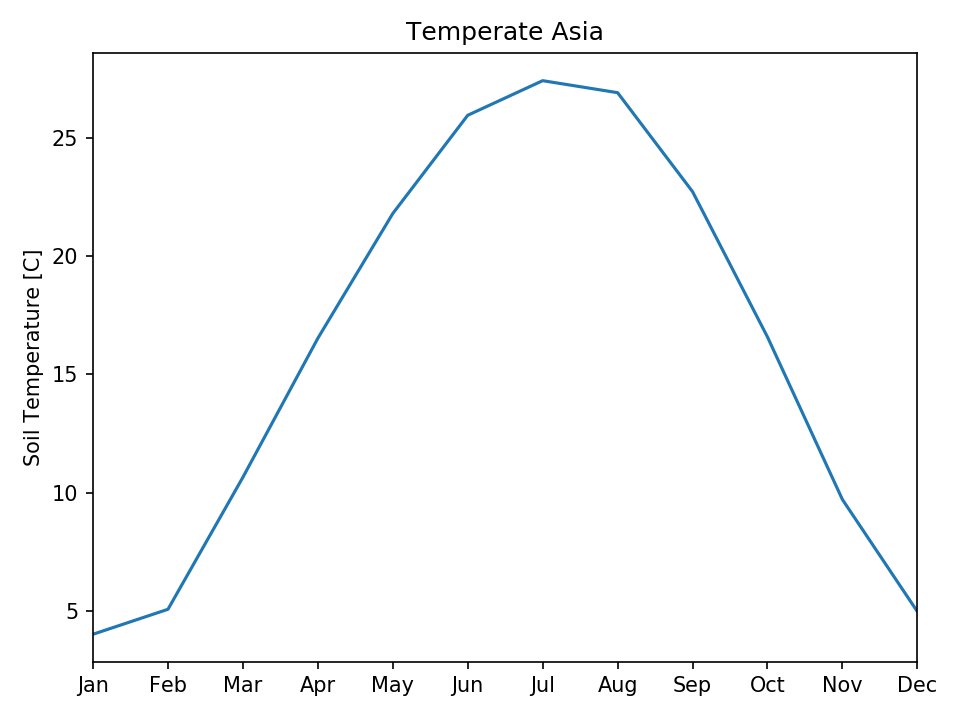
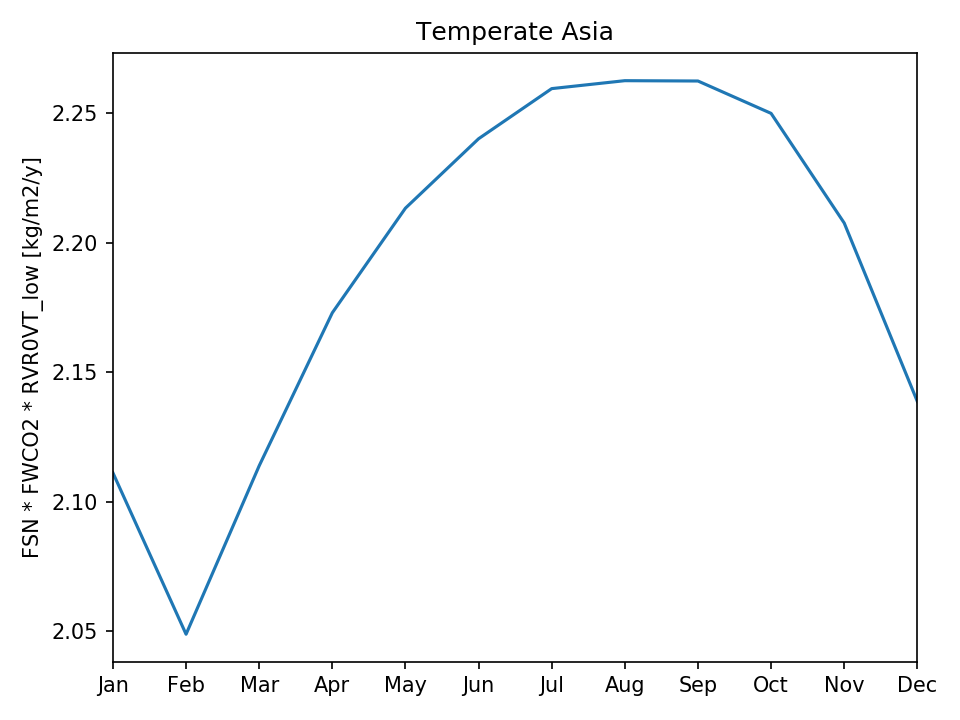
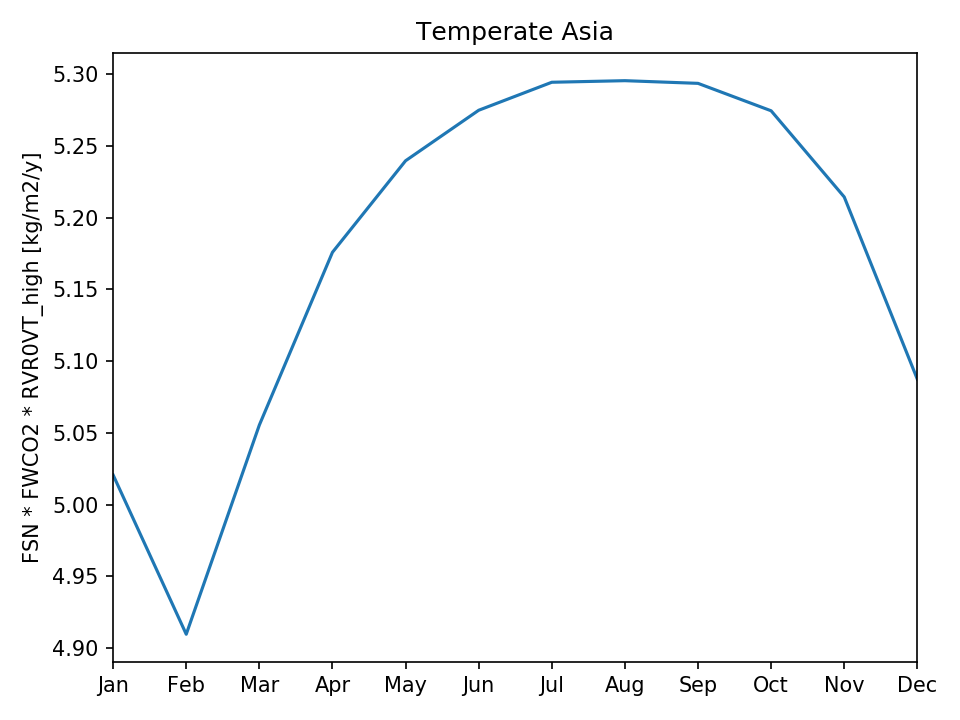
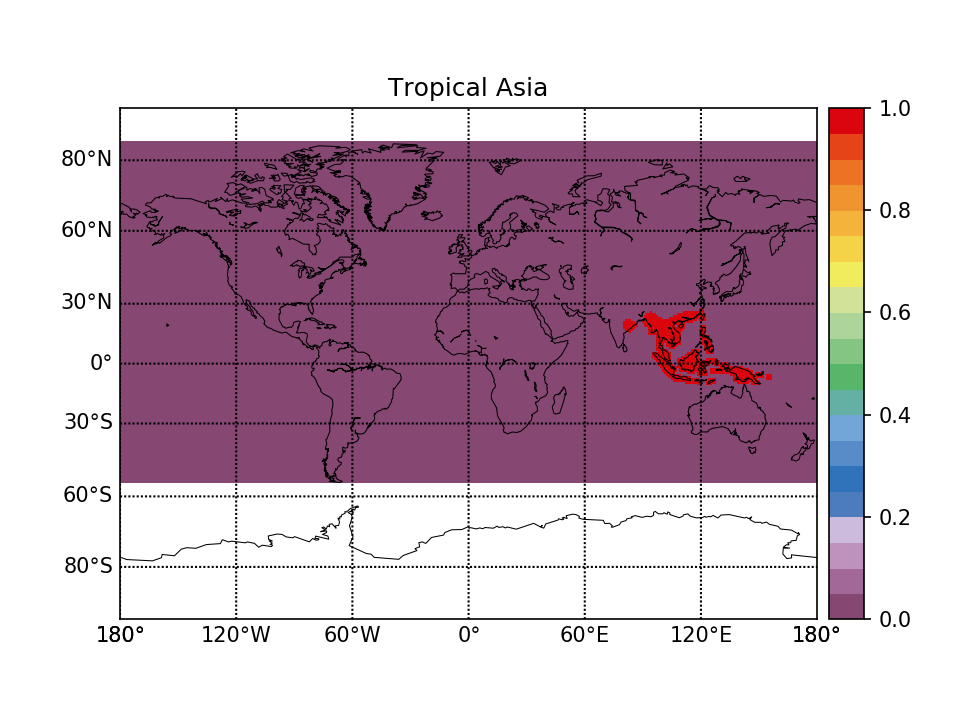
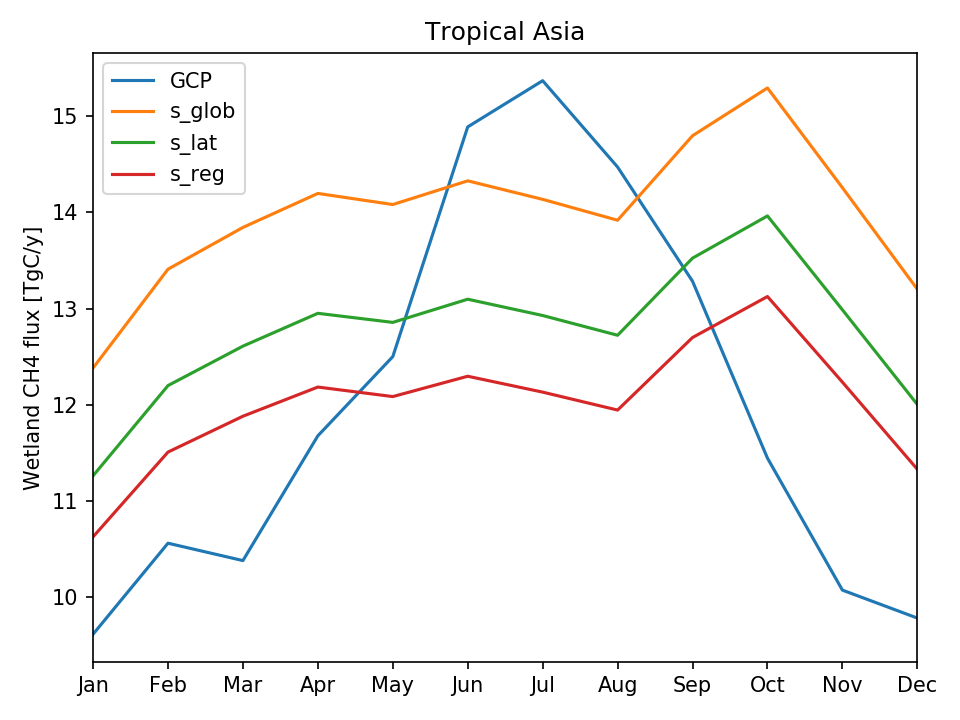
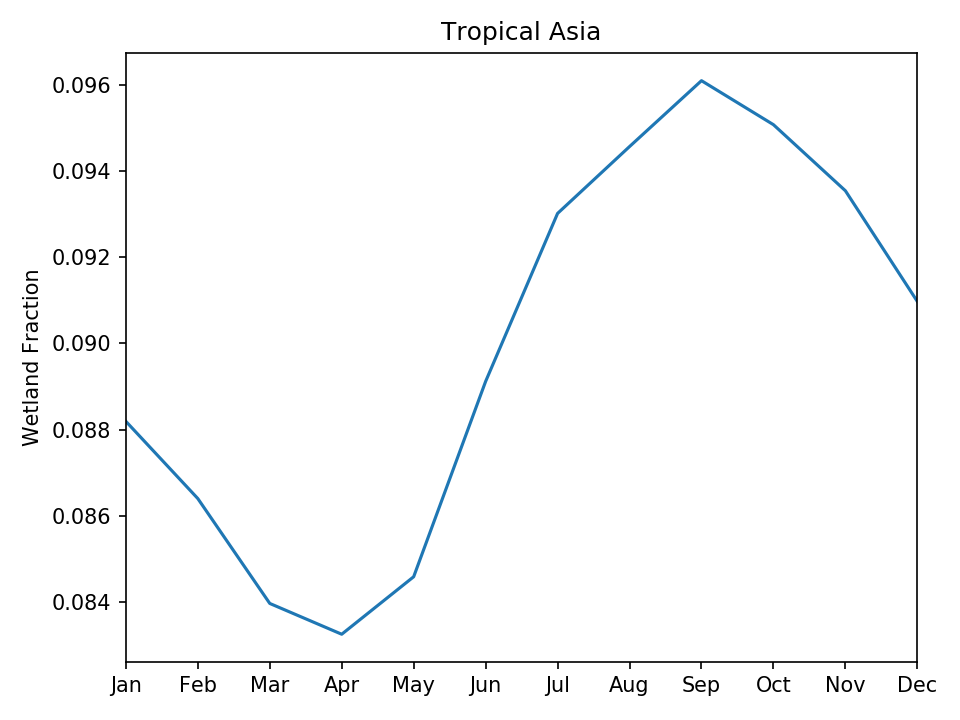
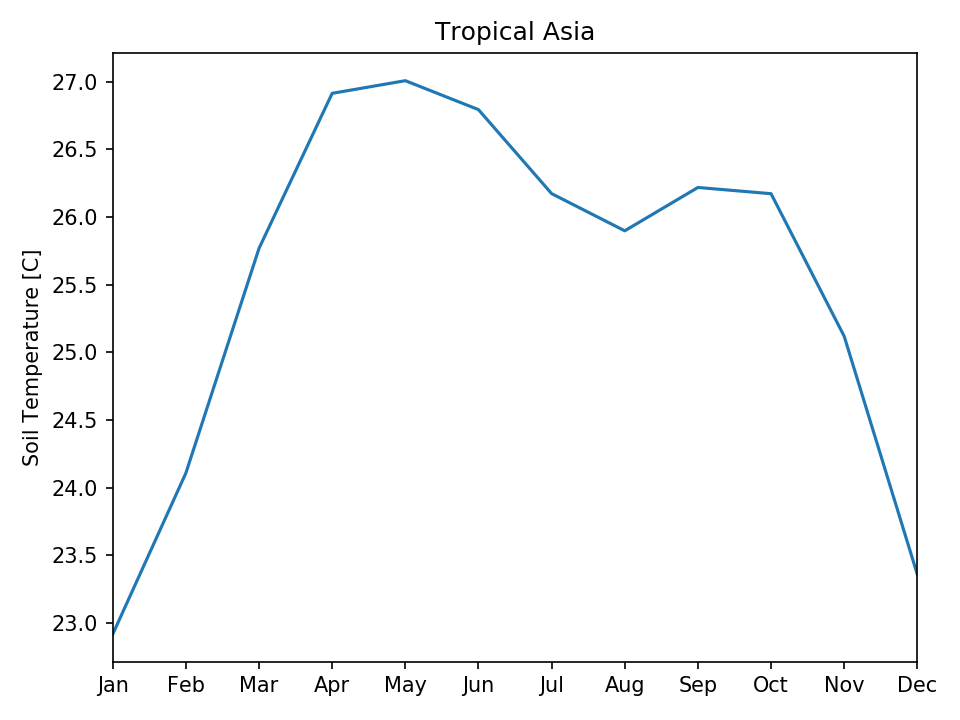
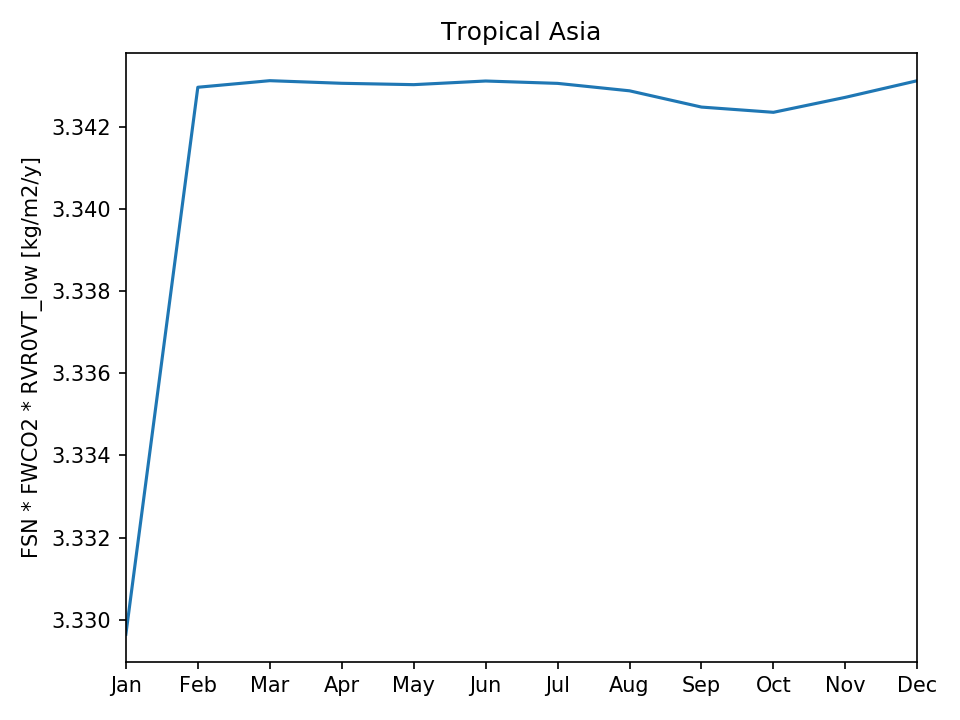
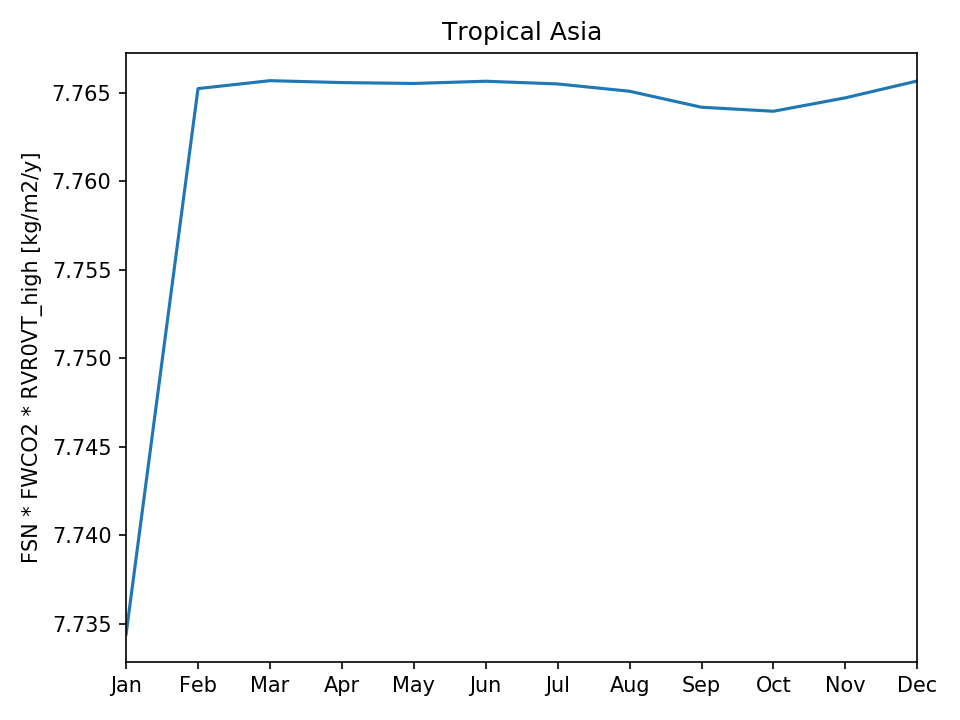
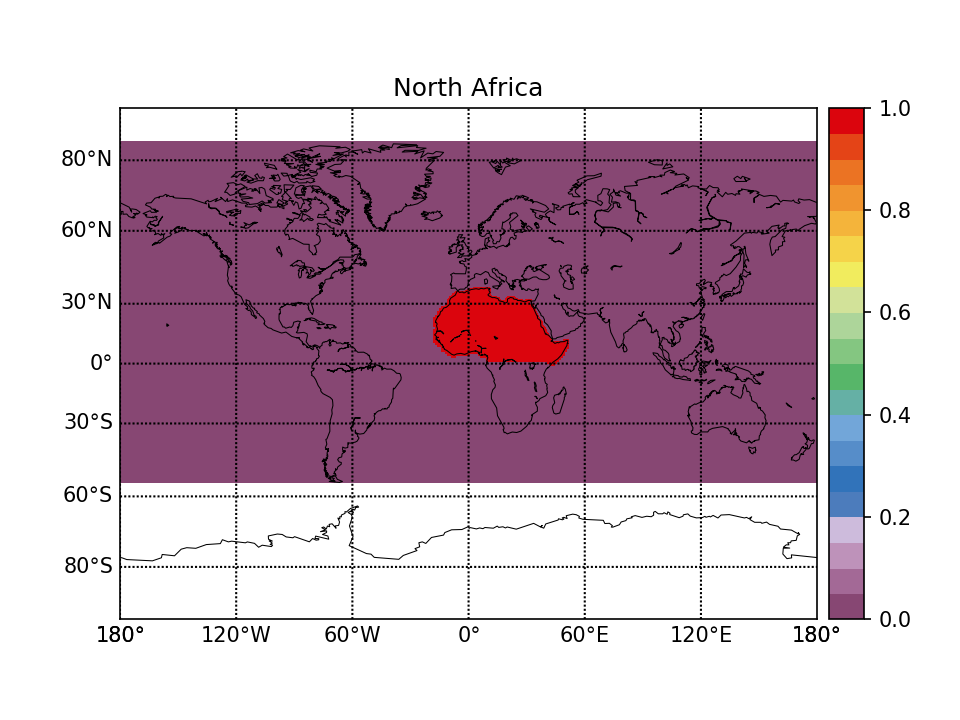
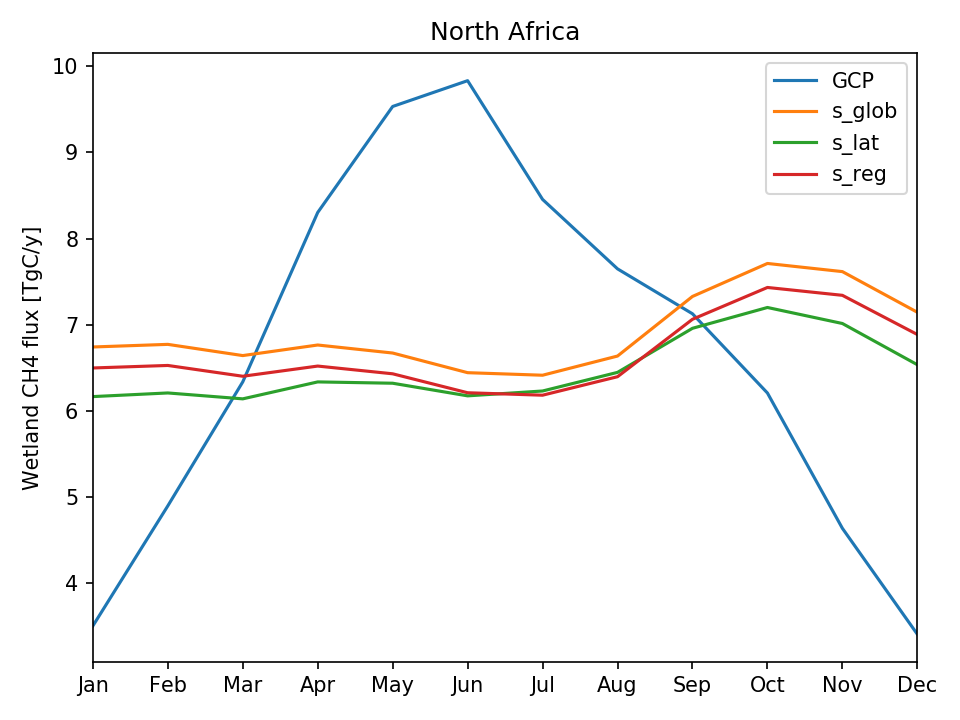
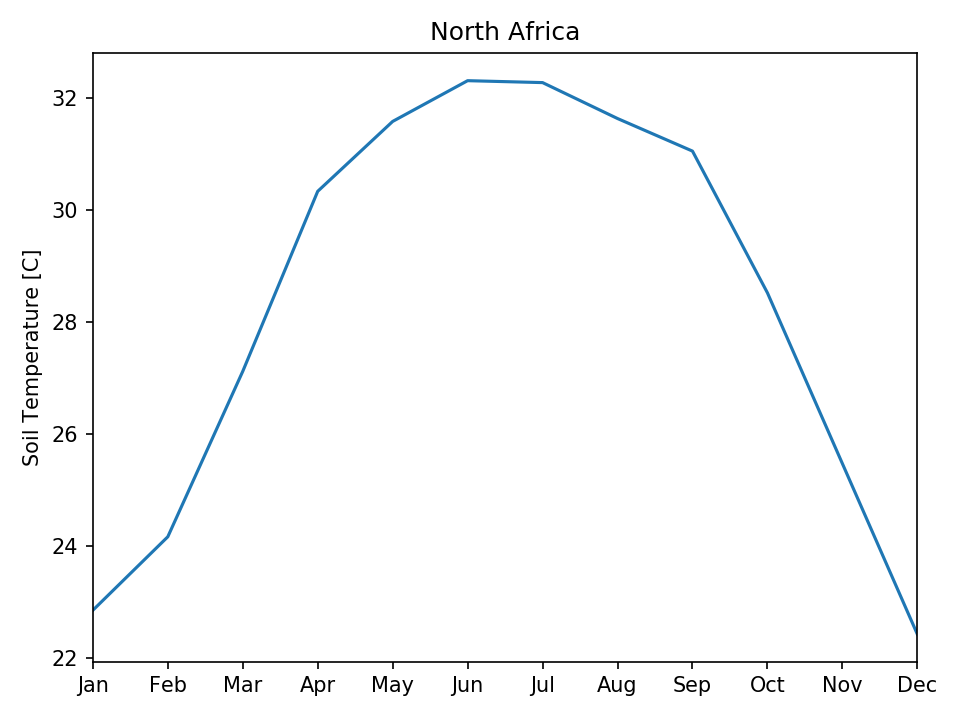
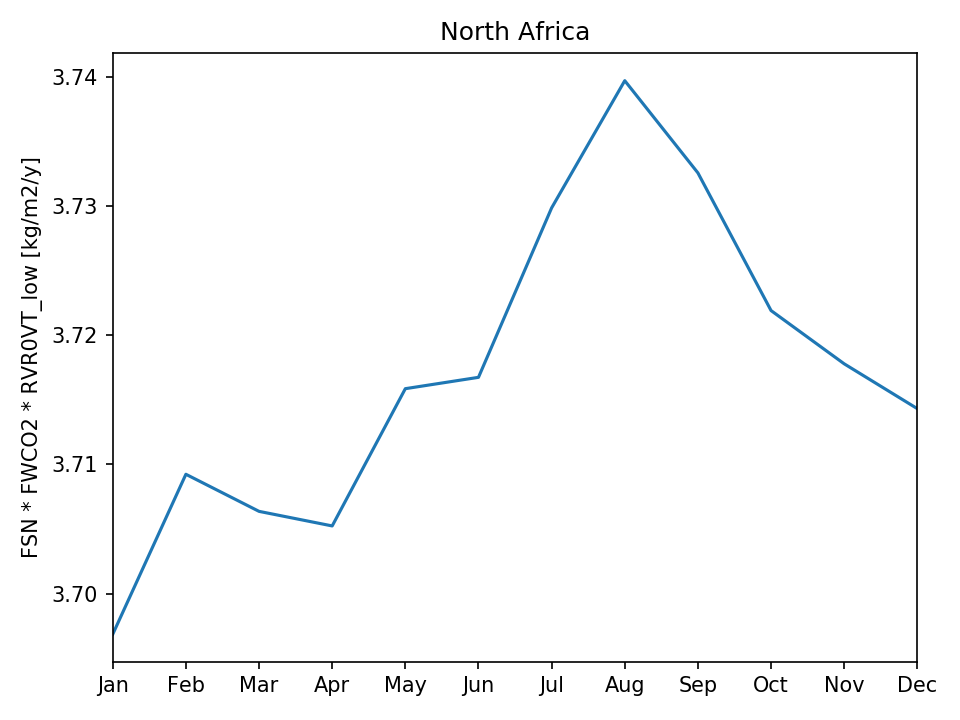
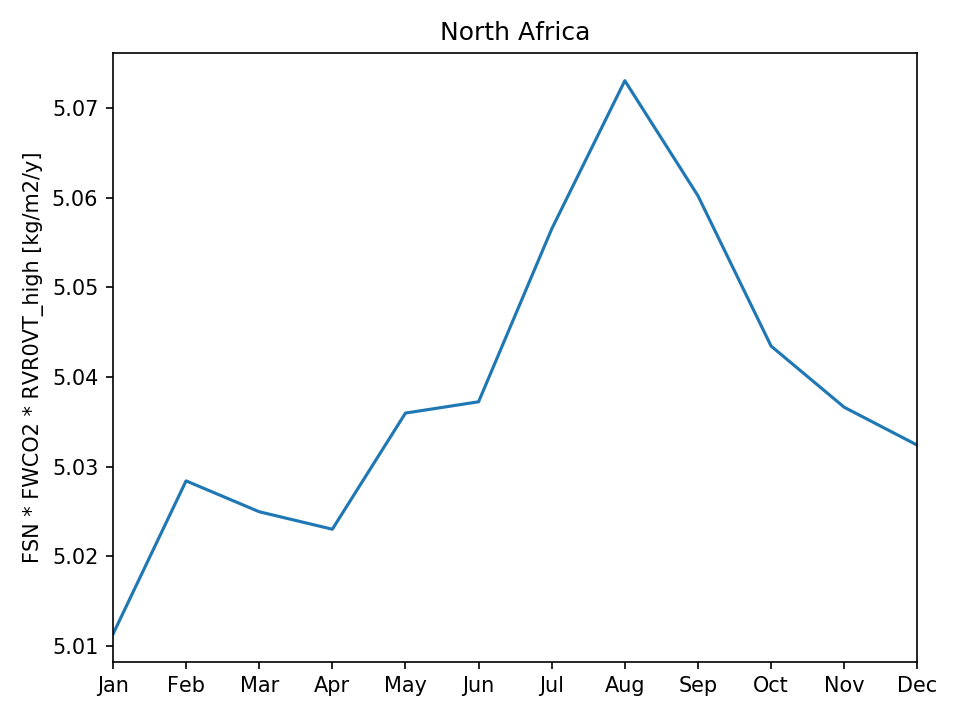
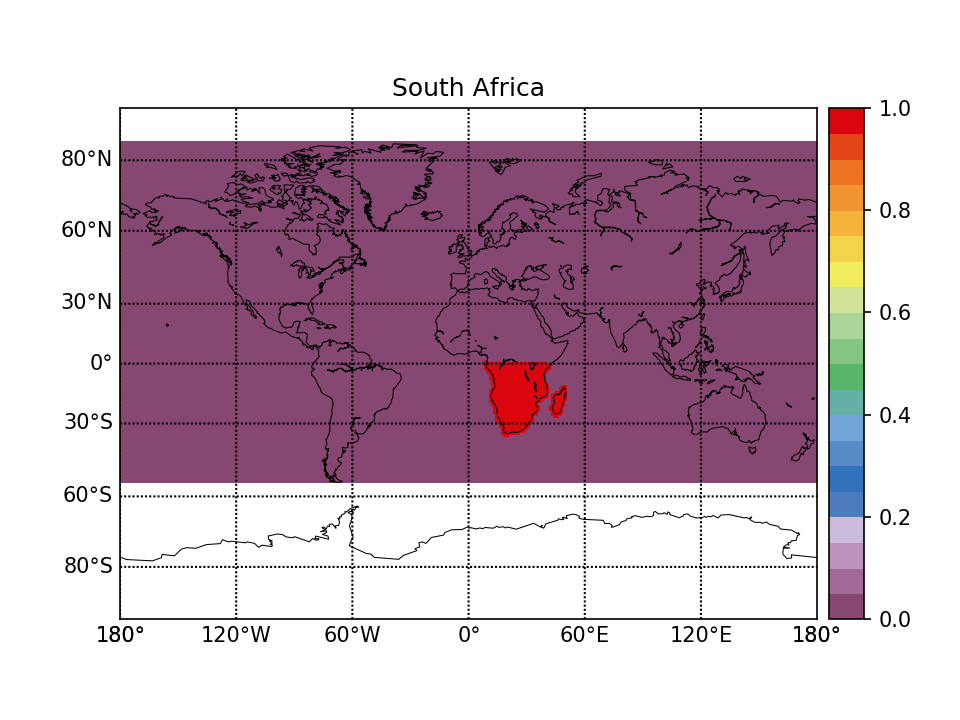
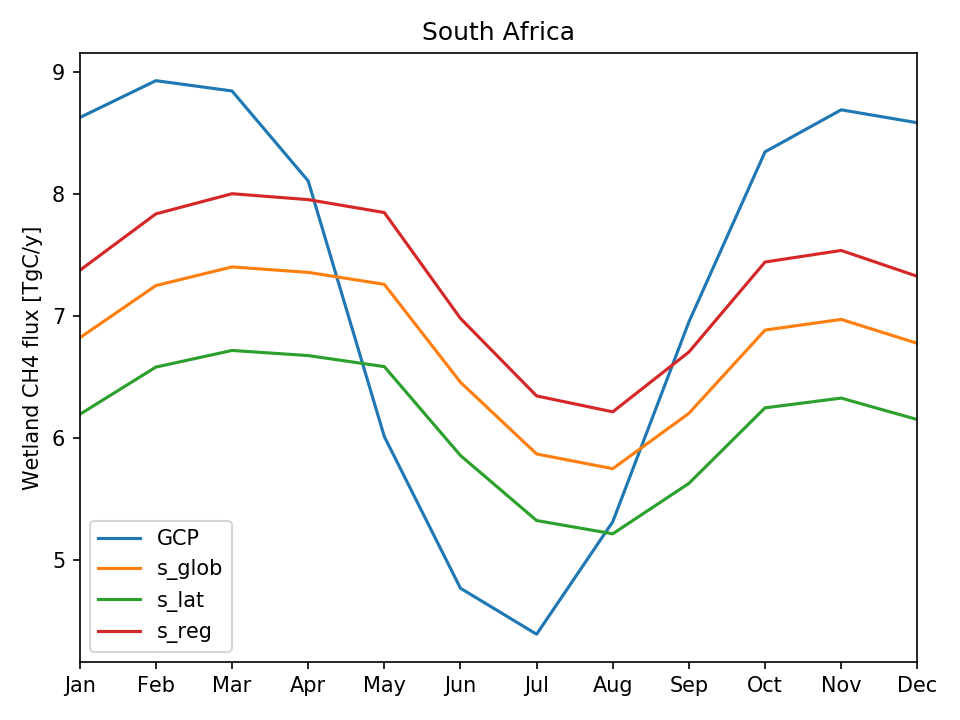
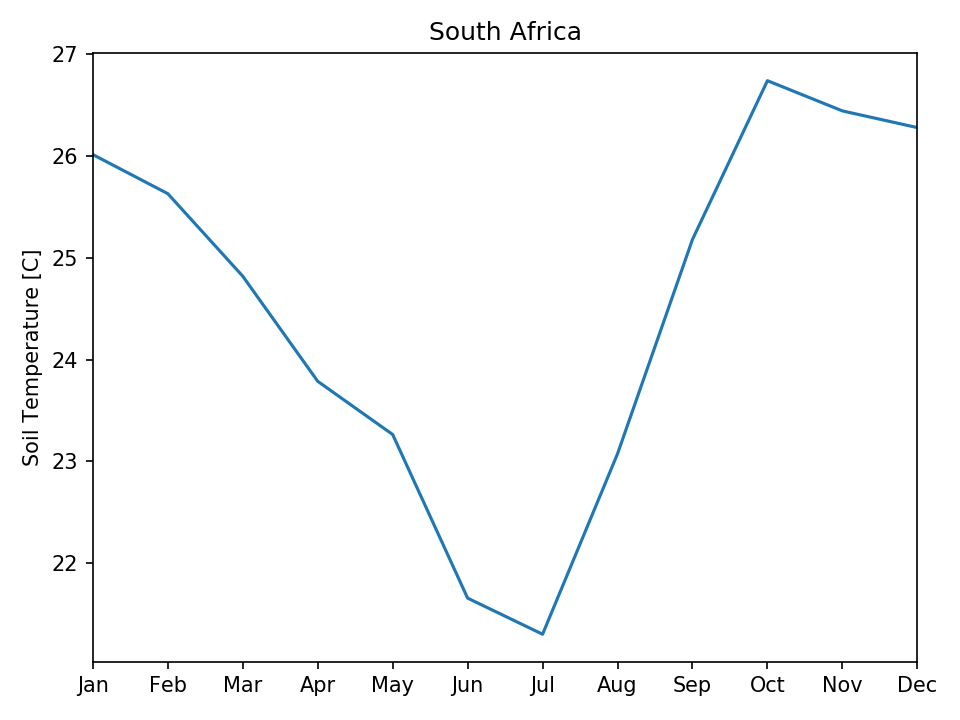
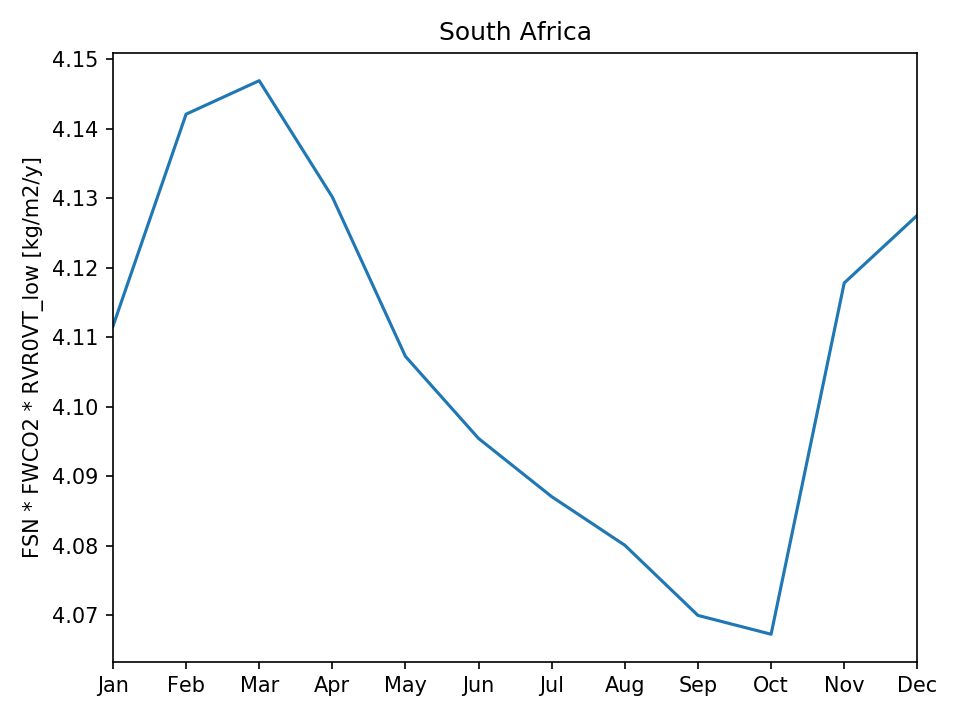
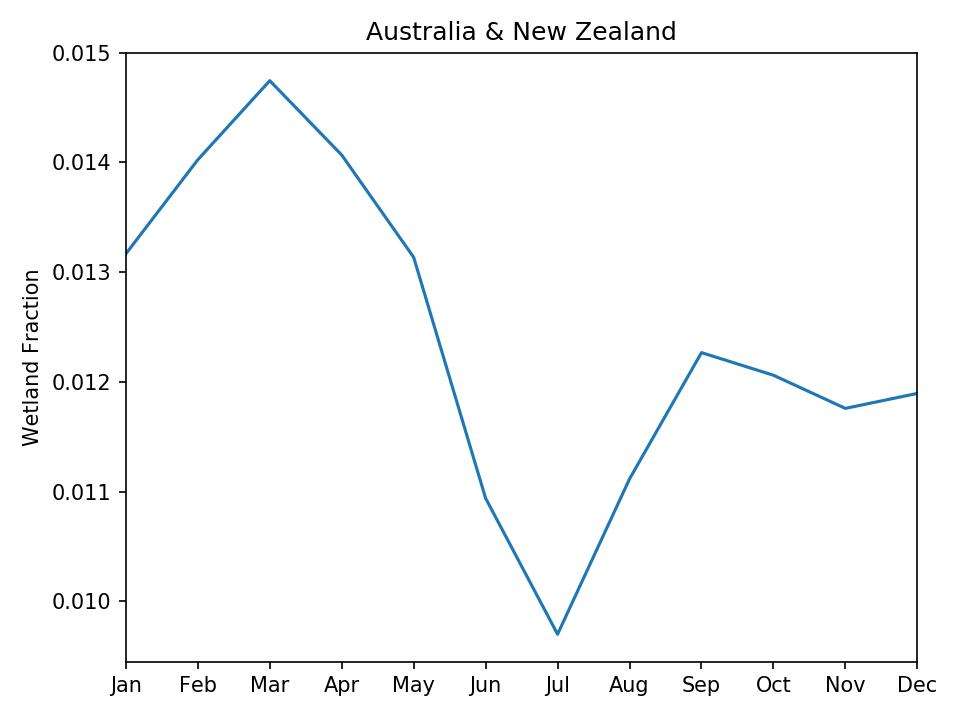
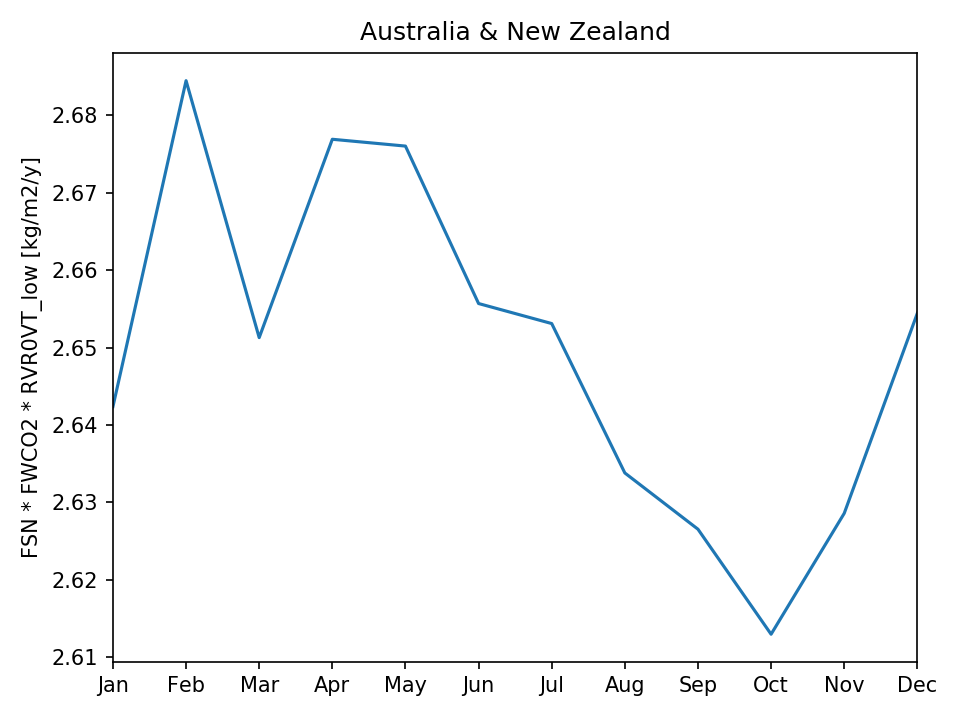
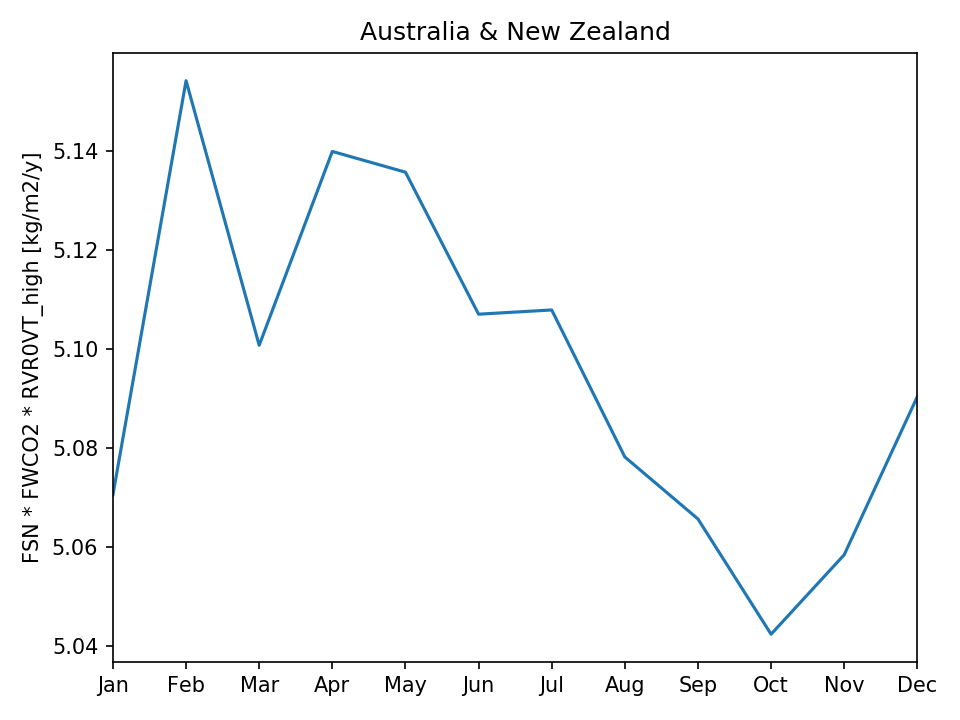
The resulting mean seasonal cycle calculated for different regions together with the components of methane emission calculation are shown in the table:
| Region mask | CH4 flux | Wetland fraction | First soil layer temperature | Low vegetation respiration | High vegetation respiration |
 |  |  |  |  |  |
 |  |  |  |  |  |
 |  |  |  |  |  |
 |  |  |  |  |  |
 |  |  |  |  |  |
 |  |  |  |  |  |
 |  |  |  |  |  |
 |  |  |  |  |  |
 |  |  |  |  |  |
 |  |  |  |  |  |
 |  |  |  |  |  |
 |  |  |  |  |  |
| Last modified: 30/06/2021 21:27:07 |
| Fluxnet-CH4b → |