

| | | | |||
| orchidas : Tutorials / ESA-DA / Part 2. Sensitivity Analysis: which parameters to choose | Site Map |
ESA-DA
|
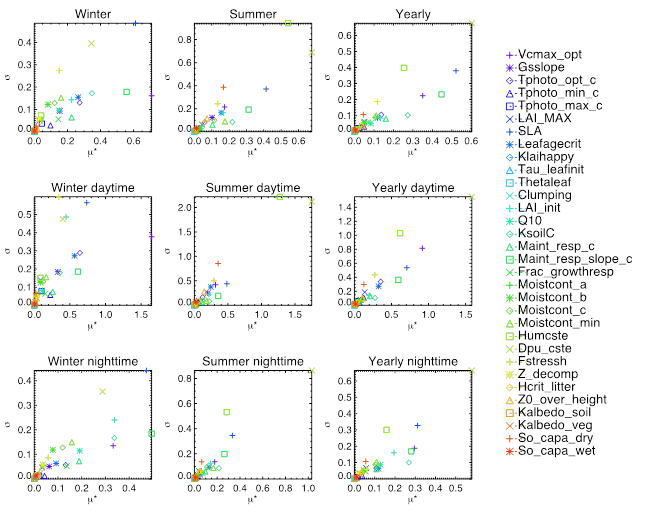
Part 2. Sensitivity Analysis — which parameters to choose It is imperative in a modelling framework to define the uncertainty in a model prediction. A sensitivity analysis identifies what the uncertainty in the model outputs is attributable to in the model inputs (parameters in this case). This is achieved by running the model for many different random samples of the parameter space to determine their impact on the model outputs. It provides information on how much of the output variance is controlled by each parameter. The more complex, variance based SA methods (e.g. Sobol, FAST ETC) give a quantitative estimate of the percentage of the variance that each parameter is responsible for. Less complex "screening" methods provide qualitative information by ranking each parameter in terms of how great an impact they have on the model outputs. These methods are less computationally expensive. The Morris method is an example of a screening method which can efficiently determine the importance of the parameters (Yang, 2010), and produces results comparable to the more complex methods (Confalonieri et al., 2010). The Morris method is based on determining incremental ratios, or "elementary effects", from which basic statistics are used to define the model sensitivity (Morris, 1991; Campolongo et al., 2007). The elementary effects are based on changing the value of one parameter at a time in sequence for many (r) trajectories which populate the parameter space. The difference in the model outputs is recorded and the mean of the absolute values (μ*) and standard deviation (σ) of the difference from all trajectories for each parameter is calculated once the sampling has finished. Therefore the parameter values are changed as per a "one-at-a-time" (OAT) sensitivity analysis, but the value of the other parameters are different each time the parameter in question is changed. This is therefore a global search method. It aims to determine which parameters have a negligible impact on the model, those which have a linear and additive effect, and those which are non-linear and are involved with interactions with other factors (Campolongo et al., 2007). For this sensitivity method one value for the model output is required. For example this could be annual flux or the mean of the difference in the daily values for the time period in question. Below are four plots which show the results of a Morris Sensitivity Analysis performed at two separate FluxNet sites with Tropical Broadleaved Evergreen Trees:
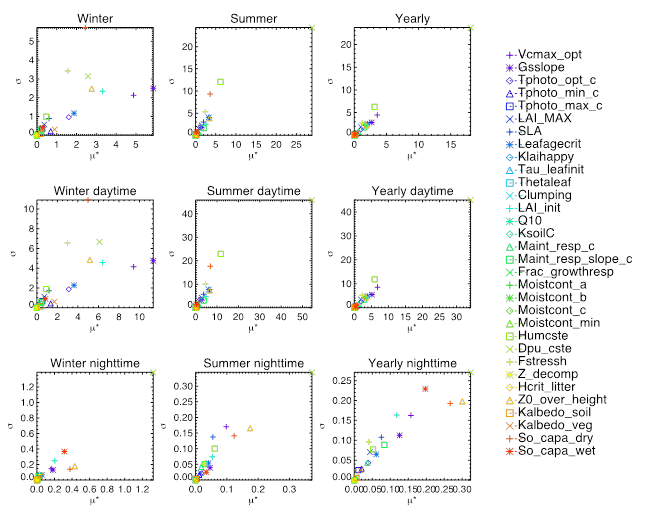
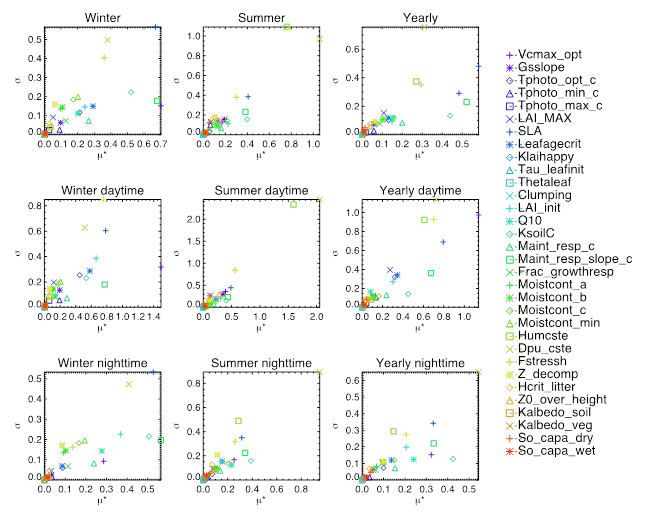
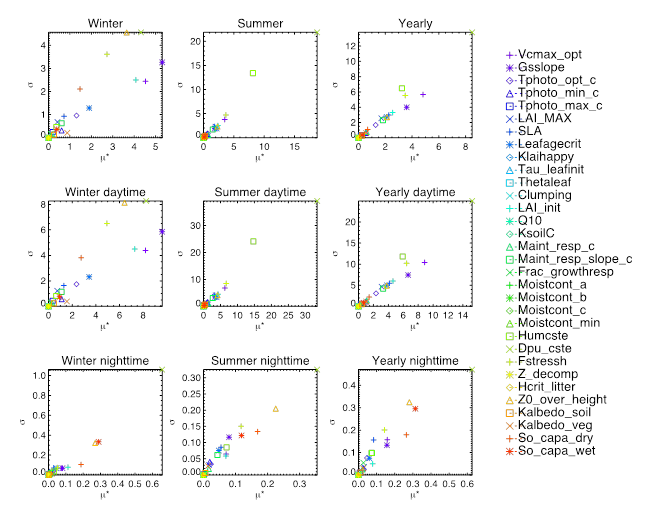
The sensitivity analysis results are shown for the NEE and LE fluxes, taking the average output at different timescales. The plots show the absolute mean of the "elementary effects" on the x-axis, and the standard deviation on the y-axis. The value of μ* can be used to rank the importance of the parameters in terms of their relative influence on the model (higher values equal higher sensitivity of the model to that parameter) but the information on the sign of the effects is also interesting. The μ or μ* of the elementary effects determines the overall sensitivity of the model to the parameter, and provides information on the higher-order effects, i.e. if the model exhibits non-linear behaviour with changing parameter value or if the parameters are correlated. The values of μ* and σ are plotted on the same graph to compare the behaviour of the parameters, and μ* of each parameter is used to rank them. The rankings of the parameters and the values of μ* are used to determine which parameters should be included in the model calibration, i.e. which are the most important parameters that contribute most to the variance in the output. Table. List of considered parameters
Take a look at the plots below and then consider the following questions. BR-Ban — NEE
BR-Ban — LE
ID-Pag — NEE
ID-Pag — LE
| ||||||||||||||||||||||||||||||||||||||||||||||||||||||||||||||||||||||||||||||||||||||||||||||||||||||||||||||||||||||||||||||||||||||||
| Last modified: 12/02/2018 10:26:30 |
| ← Part 1. Choosing data streams | Part 3. Finding the optimal parameter values → |