

| | | | |||
| orchidas : Results | Site Map |
RESULTS
1. In situ Flux Measurements : Single Site Data Optimization
|
1.1. Assimilation of NEE, LE, H and R at a temperate coniferous forest site In this first study we design a Bayesian inversion method (gradient-based) to optimize the key parameters of ORCHIDEE model against the combination of prior information upon the parameters and eddy covariance fluxes. Inversion is carried out using measurements of CO2, latent heat, and sensible heat fluxes as well as of net radiation over a pine forest in southern France. We designed an ensemble of inversions with different set ups using flux data over different time periods, in order to (1) identify well-constrained parameters and loosely constrained ones, (2) highlight some model structural deficiencies, and (3) quantify the overall information gained from assimilating each type of CO2 or energy fluxes. Assimilating 3 weeks of half-hourly flux data during the summer improves the fit to diurnal variations, but merely improves the fit to seasonal variations. Assimilating a full year of flux data also improves the fit to the diurnal cycle more than to the seasonal cycle. This points out to the key importance of timescales when inverting parameters from high-frequency eddy-covariance data. The figure illustrates the model fit to the data (NEE, LE, H, Rn) for the mean diurnal cycle during the growing season period. Ref.: Santaren D. et al., Global Biogeochem. Cycles, 21, GB2013, doi: 10.1029/2006GB002834, 2007 |
|
|
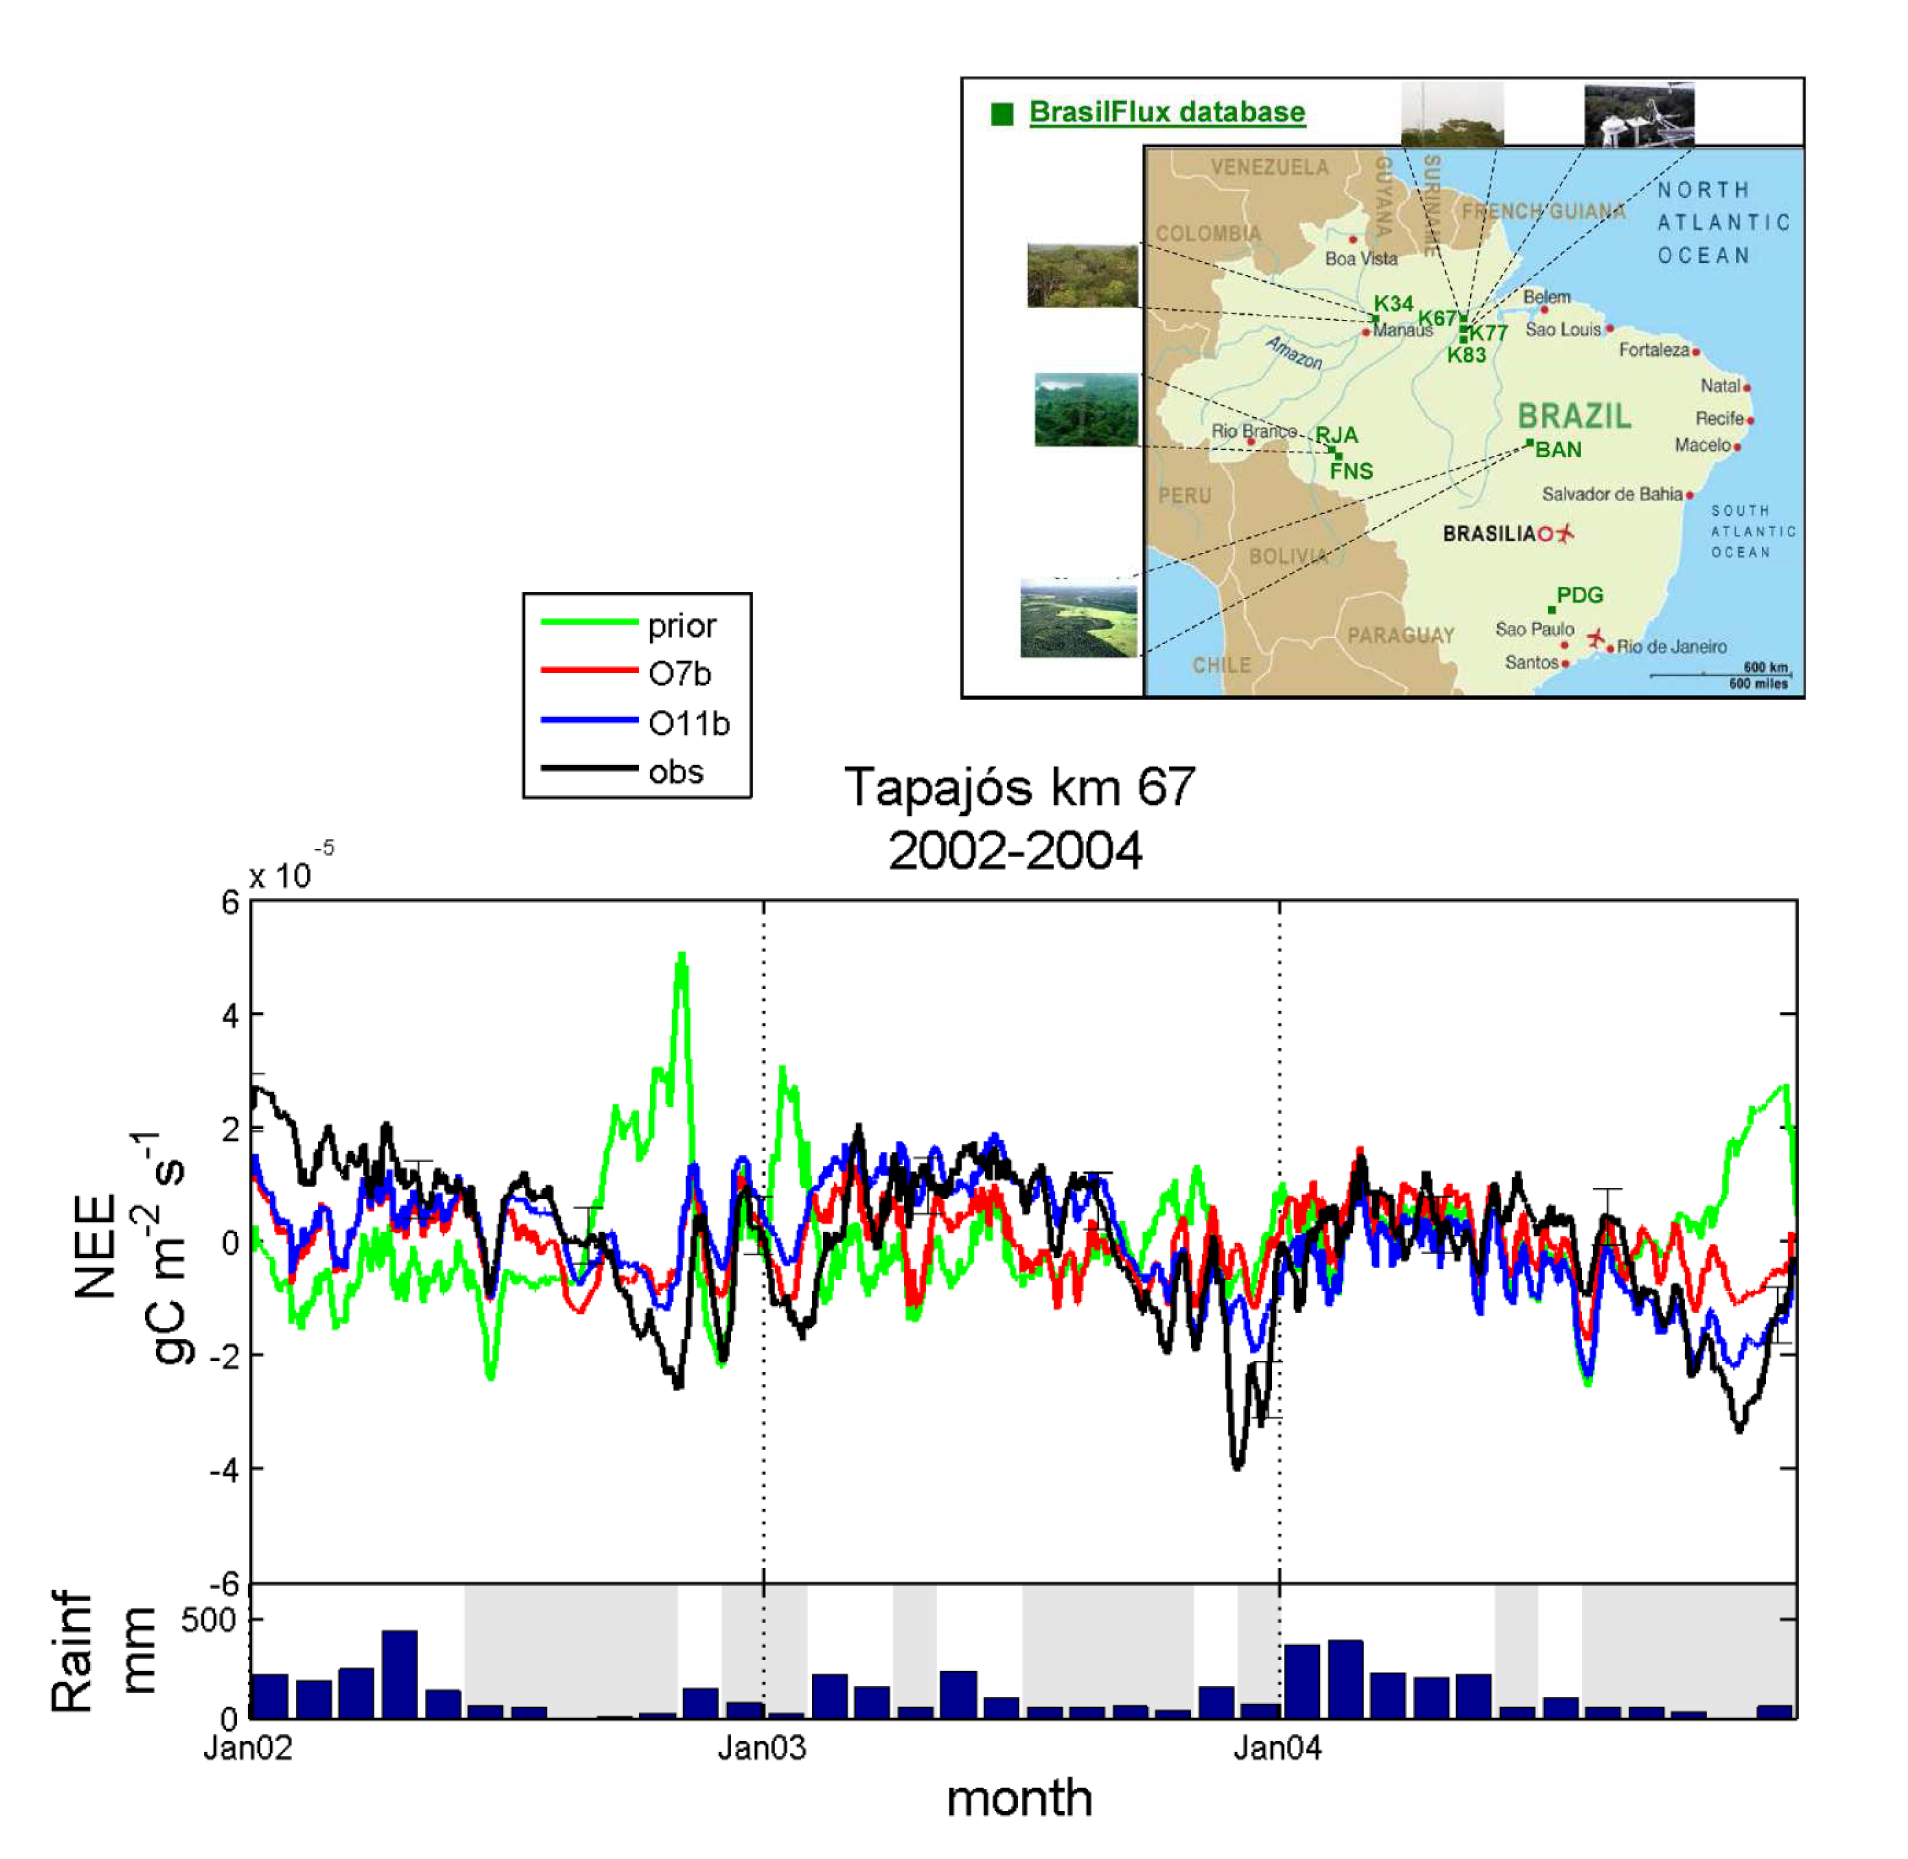
1.2. Assimilation of NEE and LE at a tropical evergreen forest site In this study a standard model parameterization of ORCHIDEE produces seasonal NEE patterns that are opposite in phase to the eddy flux data of the tropical evergreen forest at the Tapajós km 67 site (Brazil), like many other global models. However, we optimized several key parameters of ORCHIDEE using eddy covariance data of the Tapajós km 67 site. The validity of the retrieved parameter values was evaluated for two other flux tower sites in the Amazon. The different tested optimization scenarios showed that only a few parameters substantially improve the fit to NEE and latent heat (LE) data. Our results confirm that these forests have the ability to maintain high transpiration and photosynthesis during the dry season in association with a large soil depth (Dsoil = 10 m) and a rooting system density that decreases almost linearly with depth (Hroot = 0.1). In addition, our results highlight both the potential and the limitations of flux data to improve global terrestrial models. Several parameters were not identifiable and the risk of over-fitting of the model was illustrated. Nevertheless, we conclude that these models can be improved substantially by assimilating site level flux data over the tropics. Ref.: Verbeeck H. et al., J. Geophys. Res., 116, G02018, doi: 10.1029/2010JG001544, 2011 |
|
2. In situ Flux Measurements : Multiple Site Data Optimization
|
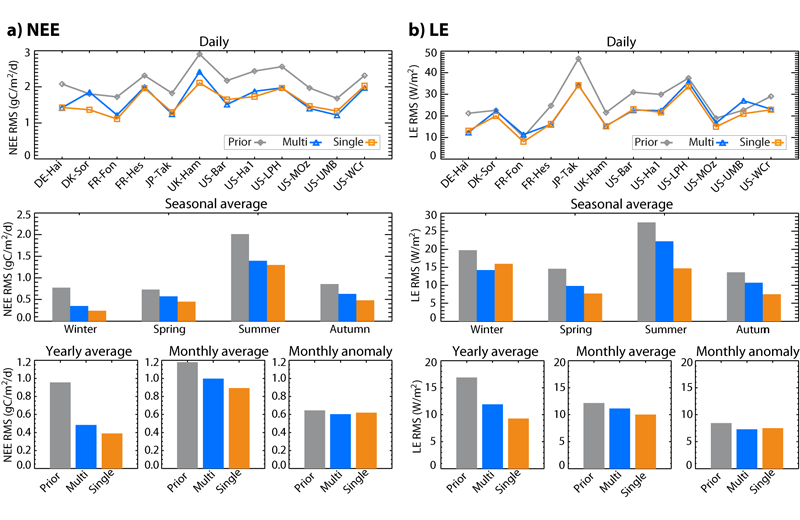
2.1. Optimizing and evaluating generic parameters from the multi-site assimilation of flux tower data Temperate deciduous broadleaf forests In a first study, we simultaneously assimilated in situ measurements of daily net ecosystem exchange (NEE) and latent heat (LE) flux from 12 temperate deciduous broadleaf forests sites, into the ORCHIDEE ecosystem model. We evaluate the ability of the model to simulate the carbon (NEE, gross primary productivity GPP, ecosystem respiration Reco) and water (LE) fluxes at these 12 sites with the set of parameters retrieved through this “multi-site” approach, as compared to those derived from separate optimizations at each site (“single-site” approach). The multi-site (MS) approach significantly decreases the model-data misfit from daily to yearly timescales, with performances consistent to those of the single-site (SS) (Fig. 3). Besides, the MS inversion system finds a unique combination of parameters which is not the simple average of the different SS sets of parameters, and yields better performances than the latter. It is also found that optimization approach in general distinctively improves the simulation of Reco, and to a lesser extent that of GPP. Finally, a global-scale simulation with MS-optimized parameters show an enhanced phase agreement between modeled leaf area index (LAI) and remote-sensing observations of normalized difference vegetation index (NDVI). Ref.: Kuppel S. et al., Biogeosciences, 9, 3757-3776, doi: 10.5194/bg-9-3757-2012, 2012 |
|
|
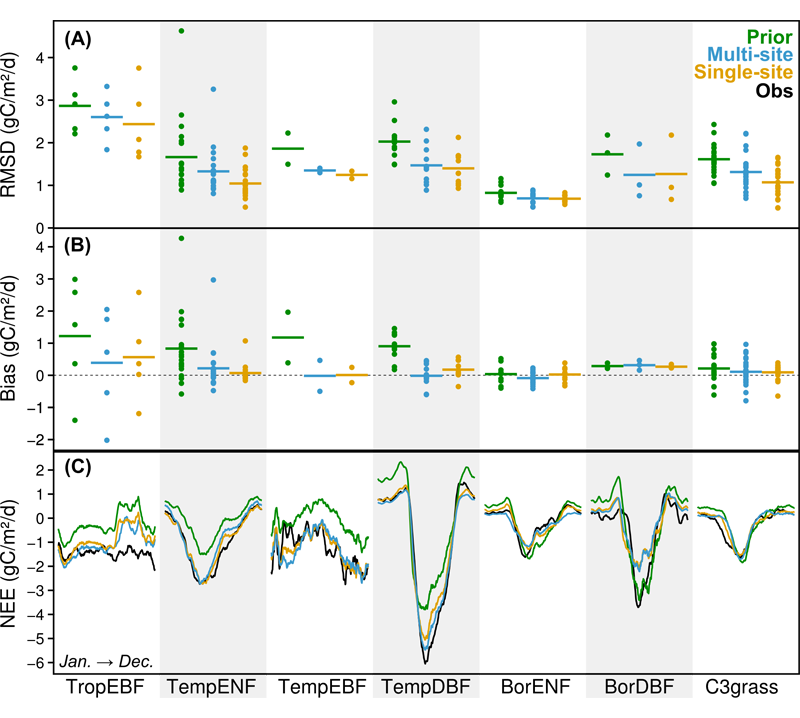
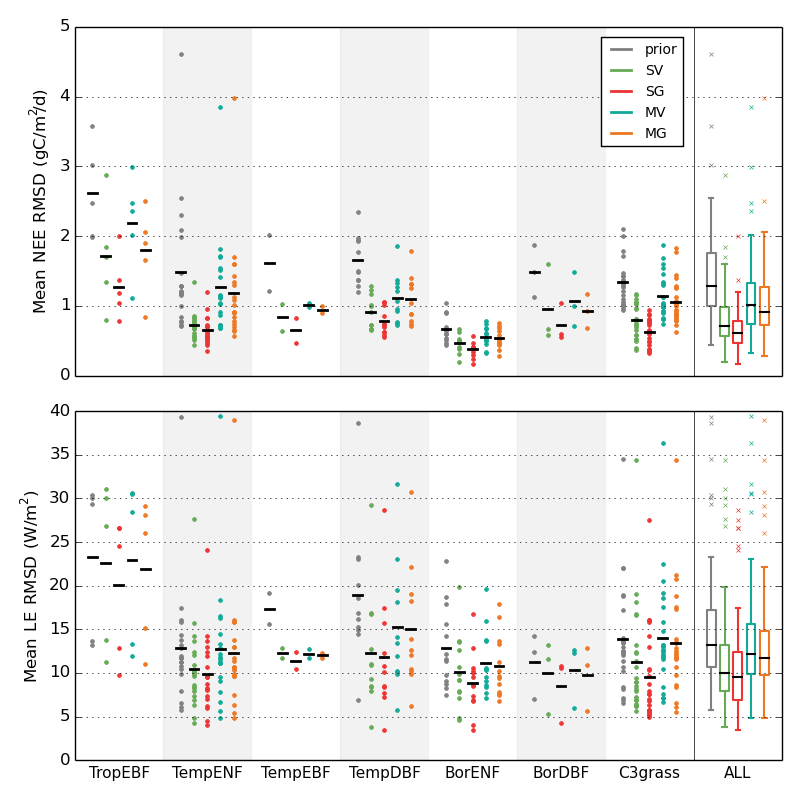
Multi-site optimization across ecosystems This second study evaluates the validity of the multi-site approach using eddy covariance measurements of daily NEE and LE from a large number of sites grouped in seven plant functional types (PFTs). The optimized PFT-generic sets of parameters are found to enhance the agreement between measured and simulated fluxes at most of the sites (Fig. 4), notably improving the CO2 balance at tropical and temperate forests sites and reducing the output uncertainty, with performances comparable to those of the SS optimizations. Comparison with estimates of GPP and Reco indicates improved simulations of both gross fluxes. Atmospheric CO2 concentration (CCO2) records from 53 locations around the globe indicates an overall improvement of the modelled CCO2 seasonality when using MS-derived parameters in earth system simulations (Fig. 5), along with a better simulated interannual variability. The NDVI/LAI evaluation methodology (see previous study) also shows a median improvement of the modelled foliar cover phenology for all PFTs. The overall poorer optimization results in tropical evergreen broadleaf forests point at structural model limitations. Ref.: Kuppel S. et al., Geosci. Model Dev., 7, 2581-2597, doi: 10.5194/gmd-7-2581-2014, 2014 |
|
|
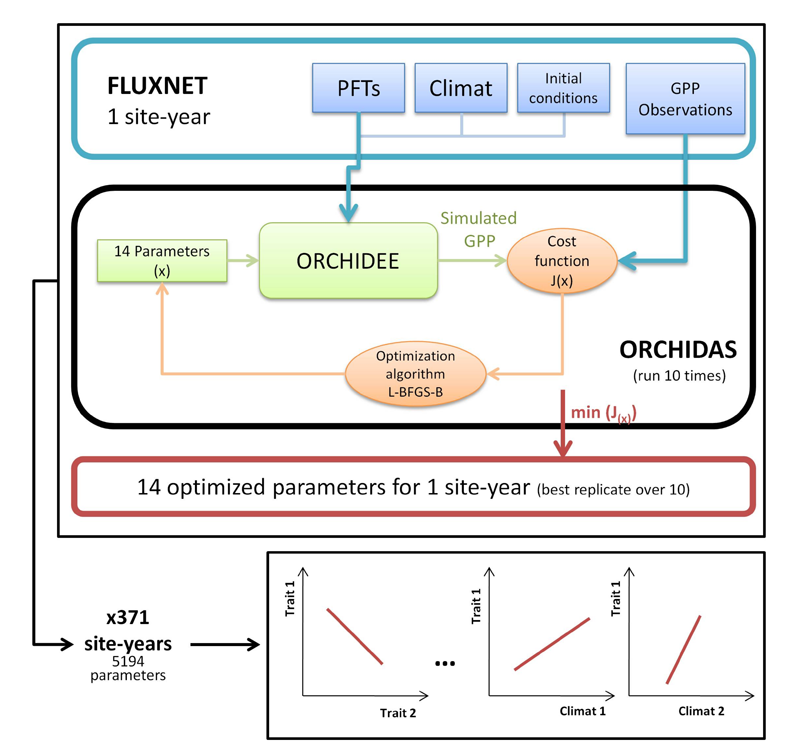
Functional traits variability inferred from data assimilation Past attempts to optimize Terrestrial Biosphere Models (TBM) parameters mostly focused on model performance and uncertainties, overlooking the ecological properties of ecosystems. In this study we assessed the ecological consistency of optimized trait-related parameters while improving the model performances for gross primary productivity (GPP) at sites. We proposed a simple protocol in which we optimized 14 parameters linked to carbon assimilation against 371 site-year estimates of GPP from eddy-covariance observations (Fig. 6). The results showed that optimized parameter values are consistent with leaf-scale traits and well-known trade-offs observed at the leaf level, echoing the leaf economic spectrum theory. Our results also highlighted a marked sensitivity of trait-related parameters to local bio-climatic variables and reproduced observed relationships between traits and climate (Fig. 7), thus validating the main GPP-related processes implemented in the ORCHIDEE model. Ref.: Peaucelle M. et al., Global Ecology and Biogeography, 28 (9), 1351-1365, doi: 10.1111/geb.12937, 2019 |
|
|
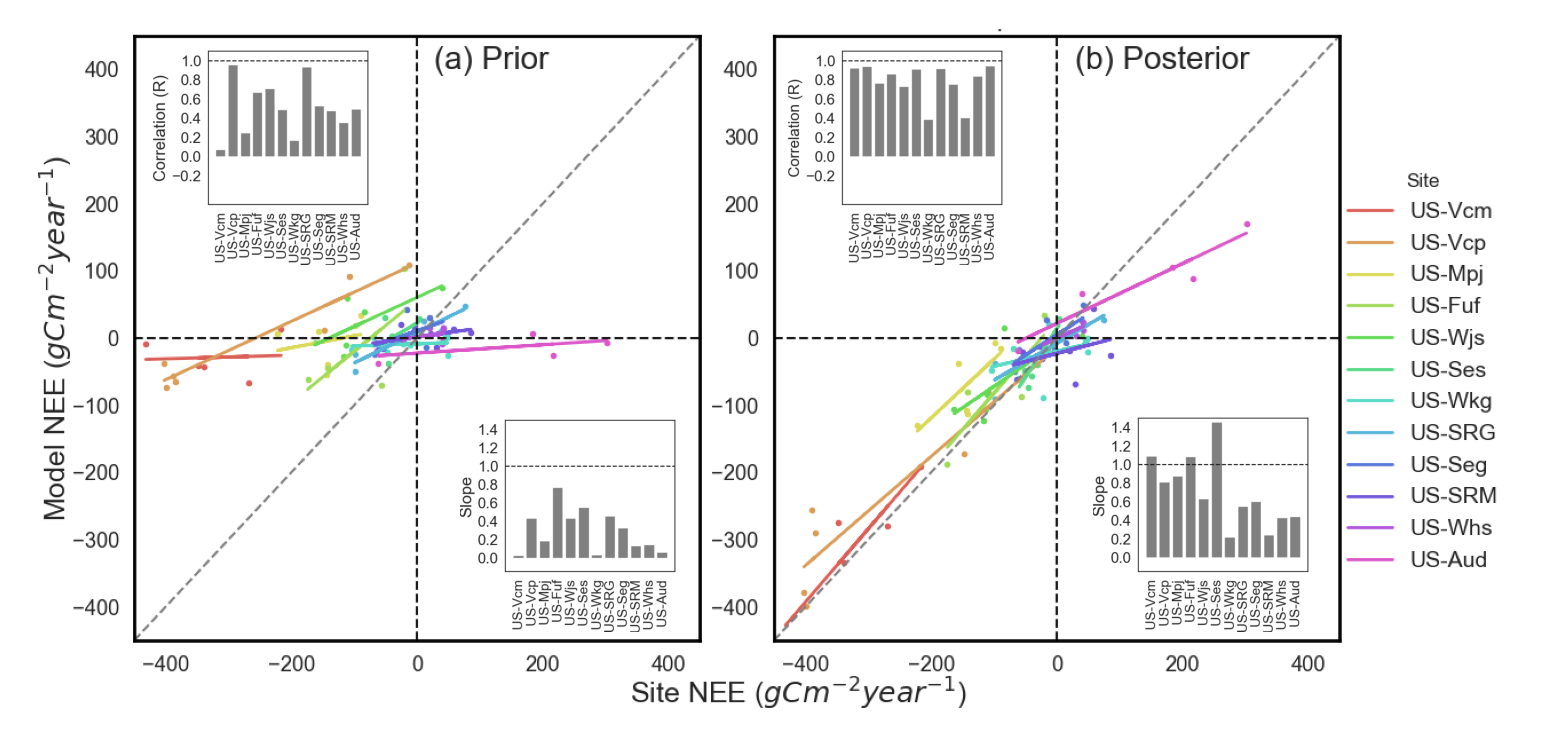
Optimizing carbon cycle parameters over the semi-arid ecosystems We used a Bayesian data assimilation (DA) framework to optimize a total of 87 parameters related to photosynthesis, phenology, carbon (C) allocation and turnover, and respiration of ORCHIDEE terrestrial biosphere model (TBM) utilizing 89 site-years of daily net ecosystem exchange (NEE) observations of 12 Ameriflux sites spanning southwest (SW) U.S. semi-arid grass, shrub and forest ecosystems. We also performed multiple optimization tests with combinations of parameters related to different model processes in order to identify which processes (and their associated parameters) were most influential in improving the model mean annual NEE and inter-annual variability (IAV). The prior ORCHIDEE simulations (i.e. before parameter optimization) fail to capture both the mean annual NEE at mean C sink and source sites and the NEE IAV across all sites. Optimizing all C cycle-related parameters (phenology, photosynthesis and post C uptake) with NEE data dramatically increases the ability of the model to capture both the mean C source/sink behavior and the IAV. Across the majority of the sites, the prior model simulates a depressed seasonal NEE amplitude and/or is unable to capture the observed bi-modal seasonality. The NEE amplitude and bi-modal seasonality generally improved when optimizing all parameters, although the posterior simulations struggle to reach the exact magnitude of the spring and monsoon NEE troughs for several sites. Accurately capturing the seasonal peaks and troughs is important for replicating observed NEE IAV because variability in summer monsoon season fluxes are the dominant driver of NEE IAV. For all sites and all assimilation scenarios the phase (seasonality) remains the largest component of the posterior daily NEE mean square deviation (MSD). The persistence of phase as the dominant component of the posterior daily NEE suggests further model improvement in processes related to dryland vegetation temporal dynamics (e.g. phenology and all associated processes) is needed before TBMs can correctly reproduce NEE seasonality and IAV for dryland ecosystems. For all assimilation scenarios, we found significant parameter deviations from prior values for numerous phenology, photosynthesis and post C uptake related parameters, which is consistent with the fact that all parameter subsets are needed to improve model mean annual NEE and IAV. There are also significant uncertainty reductions (>50%) for most of the parameters which show strong deviations from their prior value. By grouping all parameters according to their respective processes we found that phenology and post C uptake parameters had the strongest uncertainty reductions across all assimilation scenarios, while spread in reduction in photosynthesis parameter uncertainty is high. In this study, we have shown that it is possible to account for model discrepancies in both the mean annual NEE and NEE IAV at a range of semiarid SW US sites via optimization of C cycle parameters within a Bayesian DA framework. Given we chose weak prior constraints in the assimilation, the fact that some posterior parameters are hitting their bounds suggests that the optimization may be aliasing model structural error onto the parameters and/or that the model cannot improve further via parameter optimization. This suggests that further model developments are likely needed to address structural uncertainties and missing processes, which will then need to be followed up with additional parameter DA experiments to ensure increasing complexity does not degrade model skill. Our analysis demonstrated that optimizing phenology parameters are particularly useful in improving the model’s ability to capture both the magnitude and sign of the NEE IAV. At the forest sites, optimizing C allocation, respiration, and biomass and soil C turnover parameters reduces the underestimate in simulated mean annual NEE. Our study demonstrates that all TBMs need to be calibrated for dryland ecosystems before they are used to determine dryland contributions to global C cycle variability and long-term carbon-climate feedbacks. Ref.: Mahmud K. et al., J. Geophys. Res. Biogeosci., 126, e2021JG006400, doi: 10.1029/2021JG006400, 2021 |
|
|
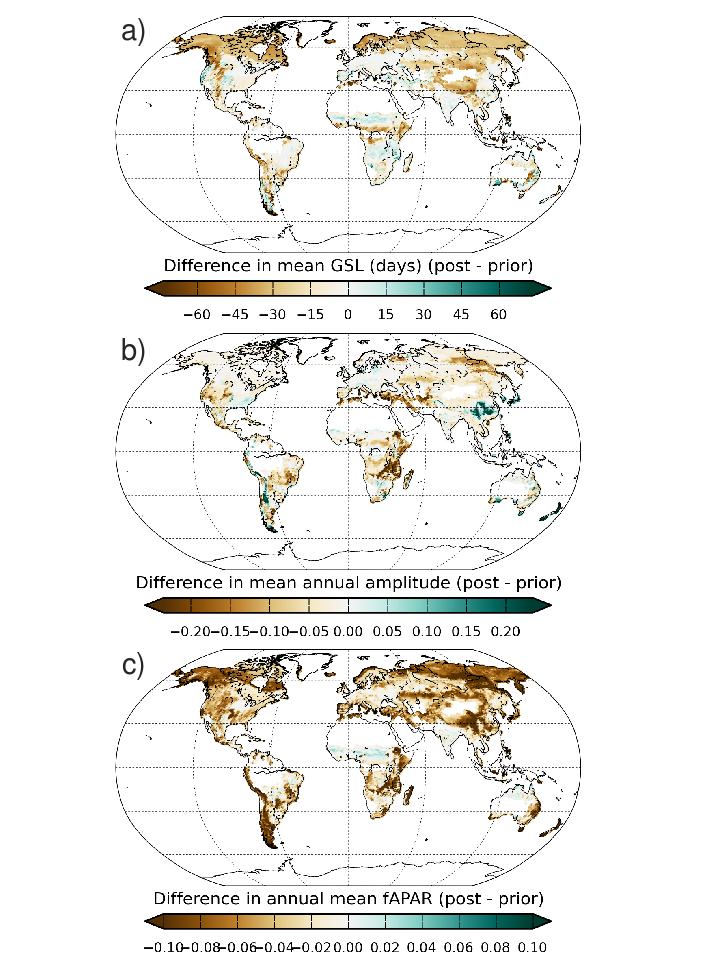
3.1. Phenology data: assimilation of NDVI data as proxy of plant phenology In order to improve the timing of the seasonal cycle of deciduous vegetation in ORCHIDEE, we have optimised the phenology-related model parameters using nine years of satellite-derived vegetation "greenness" index (NDVI) data from the MODIS instrument. We found the misfit between the observations and the model decreased for all boreal and temperate deciduous Plant Functional Types (PFTs) due to an earlier onset of leaf senescence induced primarily by higher temperature and moisture thresholds. The bias in the date of leaf onset and senescence was partially reduced for tropical deciduous trees; however, no improvement was seen for natural C4 grasses that are mainly located in the dry tropics and semi-arid regions. This suggests that the phenology models used for these regions need improvement. Spatial and temporal validation at site-level, and globally, demonstrated the generality of the posterior parameter vector for use in global simulations, with an increase in global median correlation between the model and the MODIS data of 0.56 to 0.65. The optimisation of leaf phenology resulted in a reduction in the mean global annual GPP of ~10PgC over the 1990-2010 period due to a shortened Growing Season Length (GSL) and/or smaller amplitude, thereby reducing the positive bias compared to data-based estimates. The earlier decline in carbon assimilation produced a shift in phase of the seasonal cycle of net C surface fluxes and atmospheric CO2 toward an earlier start to the period of C uptake, thus improving the fit to atmospheric CO2 concentration data measured at land-based stations. Finally, the optimisations generally caused a decrease in the strength of vegetation "greening" and "browning" trends at a global scale. Ref.: MacBean N. et al., Biogeosciences, 12, 7185-7208, doi: 10.5194/bg-12-7185-2015, 2015 |
|
|
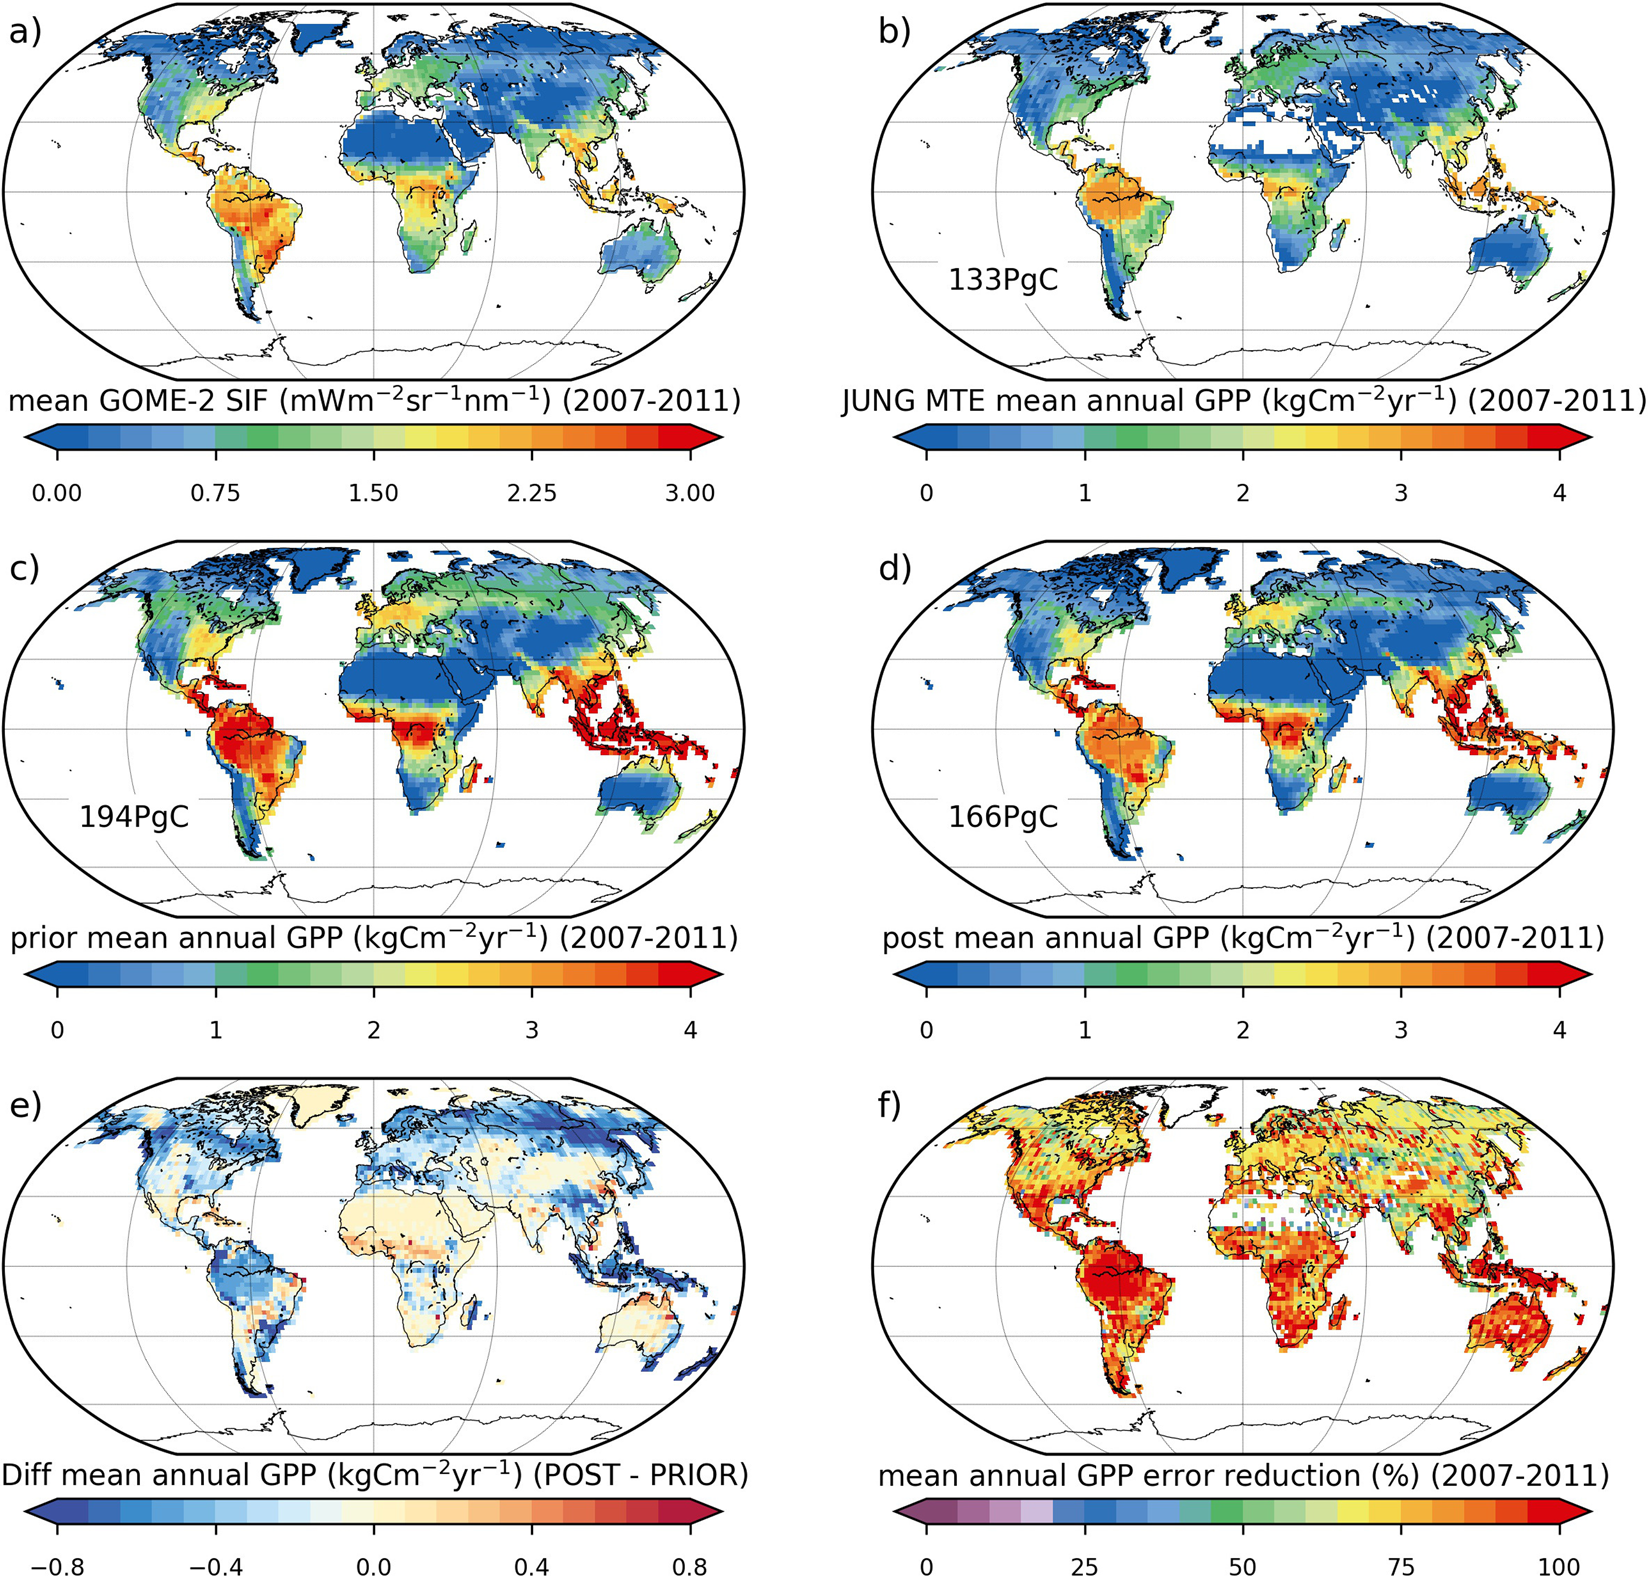
3.2. Fluorescence data Assimilation of GOME-2 SIF data with a parametric SIF observation operator The aim of this study to investigate the potential benefit of using a global, satellite-derived fluorescence (SIF) dataset to constrain and improve carbon cycle simulations of the ORCHIDEE model. Given the apparent strong linear relationship between GPP and fluorescence (Frankenberg et al., 2011; Guanter et al., 2012), the aim is first to optimize the parameters of the linear relationship between fluorescence and GPP (SIF = a GPP + b) as well as parameters relating to photosynthesis and phenology, in order to determine if the fluorescence data provide a direct constraint on the carbon uptake. We used monthly 0.5° GOME-2 SIF data from 2007 to 2011 to optimise GPP-related parameters (photosynthesis and phenology) of ORCHIDEE. The optimisation reduces GPP magnitude across all vegetation types except C4 plants. Global mean annual GPP therefore decreases from 194 ± 57 PgC/yr to 166 ± 10 PgC/yr, bringing the model more in line with an up-scaled flux tower estimate of 133 PgC/yr. Strongest reductions in GPP are seen in boreal forests: the result is a shift in global GPP distribution, with a ~50% increase in the tropical to boreal productivity ratio. This work was supported and co-funded by the ESA FLEX-Bridge Project in collaboration with colleagues at University College London (http://www.flex-photosyn.ca), the Copernicus Atmosphere Monitoring Service (CAMS41 project) implemented by the European Centre for Medium-Range Weather Forecasts (ECMWF) on behalf of the European Commission, and the CNES TOSCA Flu-OR Project. Ref.: MacBean N. et al., Scientific Reports, 8, 1973, doi: 10.1038/s41598-018-20024-w, 2018 |
|
|
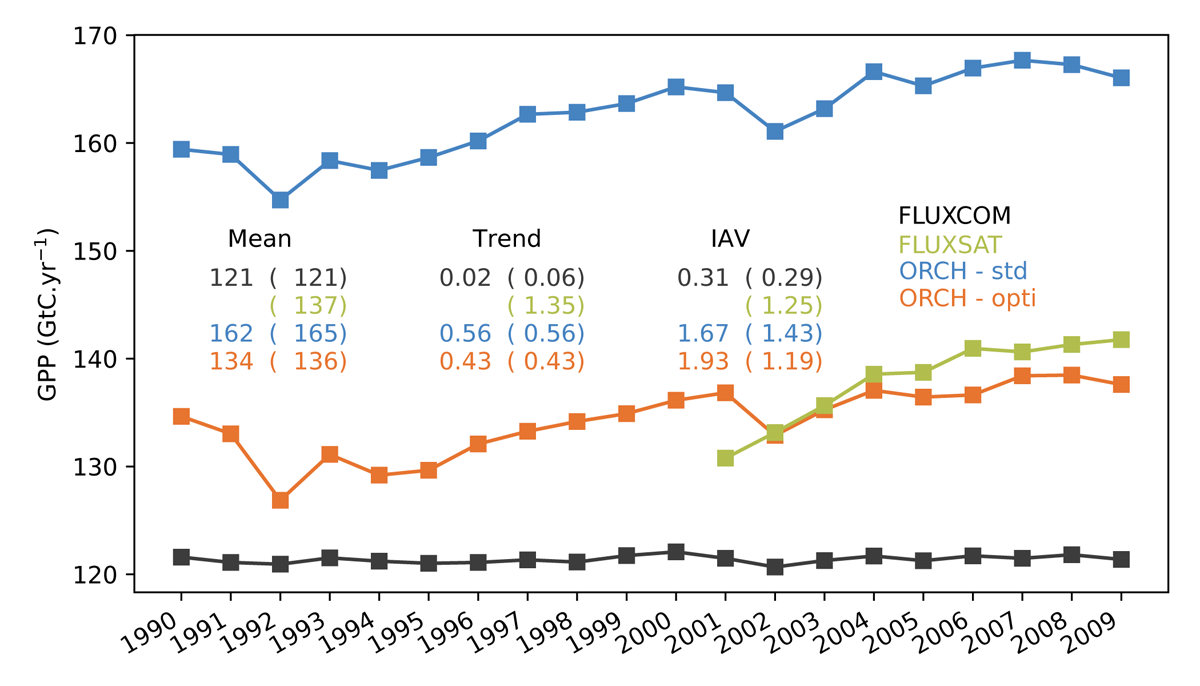
Assimilation of OCO-2 SIF data with a mechanistic SIF observation operator We developed a mechanistic SIF observation operator in ORCHIDEE. It relies 1) on the simulation of the regulation of the PSII fluorescence quantum yield at the leaf level, following the lake model formalism and using a novel parameterization of NPQ as a function of temperature, PAR and the normalized quantum yield of photochemistry, and 2) a parametric simplification of the SCOPE model to emulate the radiative transfer of chlorophyll fluorescence to the top of the canopy. We then assimilated two years of monthly OCO-2 SIF product at 0.5° (2015-2016) to optimize ORCHIDEE photosynthesis and phenological parameters over an ensemble of grid points for the 14 vegetation plant functional types (PFTs). The impact on the simulated GPP was considerable with a large decrease of the global scale budget by 28 GtC.yr-1 over the period 1990-2009. The optimized GPP budget (134 / 135 GtC.yr-1 over 1990-2009 / 2001-2009) remarkably agrees with independent GPP estimates, FLUXSAT 137 GtC.yr-1 over 2001-2009) in particular and FLUXCOM (121 GtC.yr-1 over 1990-2009). The positive trend of the model was decreased from 0.56 GtC.yr-2 to 0.43 GtC.yr-2 for both 1990-2009 and 2001-2009 periods. It was hence in closer agreement with mean linear trends estimated in the literature from several models (for instance 0.41 GtC.yr-2 both over the period 1990-2009 in Anav et al. (2015) and over the period 2000-2010 in Chen et al. (2019); 0.35 GtC.yr-2 over the 1981-2010 period in Ito et al. (2017)) , but departed from the higher positive trend of FLUXSAT (1.35 GtC.yr-2 over 2001-2009). That positive trend in ORCHIDEE is due to the fertilization effect of increasing CO2 atmospheric concentrations to which the model is sensitive, although moderated by a down-regulation effect that mimics the role of nitrogen limitation on photosynthesis in the version used, and to the increasing surface temperatures. The reasons for these large changes vary between PFTs. For deciduous trees and C3 and C4 grasses and crops, it was attributed to a decrease of the growing season length mostly; for tropical forests, temperate and boreal evergreen trees as well as C3 and C4 grasses and crops, it can also be related to a reduction of the leaf area and photosynthetic capacities. At global scale, this translated into a decrease of the gross primary productivity over the Tropics principally, Europe and over a large area covering the Northwestern part of North America; at the opposite, an increase in GPP was obtained in the US corn belt and over boreal Asia. Our results also suggest a biome dependency of the SIF-GPP relationship that needs to be improved for some PFTs. Ref.: Bacour C. et al., J. Geophys. Res. Biogeosci., 124, 10, 3143-3157, doi: 10.1029/2018JG004938, 2019
|
|
4. In situ Flux Measurements & Satellite-derived fAPAR Data
|
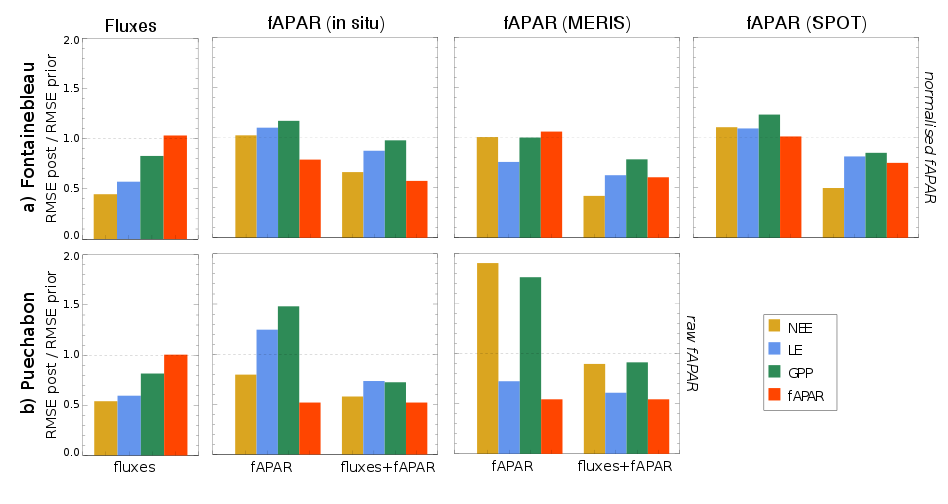
We have evaluated to potential benefit of jointly assimilating eddy-covariance flux measurements and fAPAR products in order to improve the simulations of the ORCHIDEE terrestrial biosphere model with ORCHIDEE Data Assimilation System. The study relies on measurements of net carbon exchange (NEE), and latent heat (LE), fluxes at two instrumented sites - Fontainebleau (deciduous broadleaf forest) and Puechabon (Mediterranean broadleaf evergreen forest) – and fAPAR time series measured in situ and derived from spaceborne observations at high (SPOT) and medium (MERIS) spatial resolutions. Each data stream has first been assimilated separately and we have analysed the subsequent effect on the other data streams. The strong discrepancies between the various fAPAR products, mainly in terms of mean magnitude, has led to significantly different model response after assimilation. In particular a degradation of the model-data agreement with respect to NEE has been obtained at the two sites. Interestingly, combining flux measurements with one or the other fAPAR products in the assimilation has lead to a model-data agreement of the same order than when each data stream was assimilated separately. The results suggest that assimilating fAPAR observations can bring additional knowledge on vegetation functioning (mainly phenology), which is best achieved by assimilating normalised fAPAR time series for ecosystems with pronounced seasonal cycle, but that it has to be accounted for with caution when assimilated alone, at the risk of falsifying the model. Ref.: Bacour C. et al., J. Geophys. Res. Biogeosci., 120, 1839-1857, doi: 10.1002/2015JG002966, 2015 |
|
5. In situ Flux Measurements & Biomass Data
|
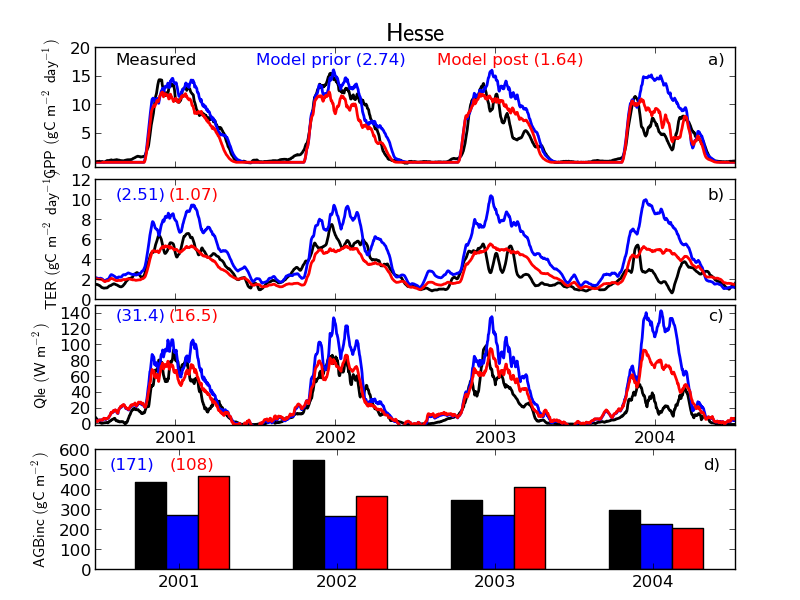
We demonstrated the use of biomass data with the ORCHIDEE Data Assimilation System at two temperate forests in France, Beech forest Hesse and Maritime pine forest Le Bray. In addition to the micrometeorological fluxes, we used annual values for biomass increments and tested how to use the total aboveground biomass (AGB) measurements. We used the biomass data to optimize the parameters related to allocation. The use of biomass increment with the flux data was successful with improvement in all the data streams (Fig. 12). However, the use of AGB was more challenging. We used AGB to optimize mortality on longer time scale, but as the clear cuts and storms were not described in the model, we obtained too high mortality rate for the forest. Overall, use of annual biomass increment improved allocation to more realistic direction in light of the observations at Hesse, but the use of AGB requires a model version with more event description. Ref.: Thum et al., Agricultural and Forest Meteorology, 234, 48-65, doi: 10.1016/j.agrformet.2016.12.004, 2017 |
|
6. In situ Flux Measurements & Satellite & Atmospheric CO2 Data
|
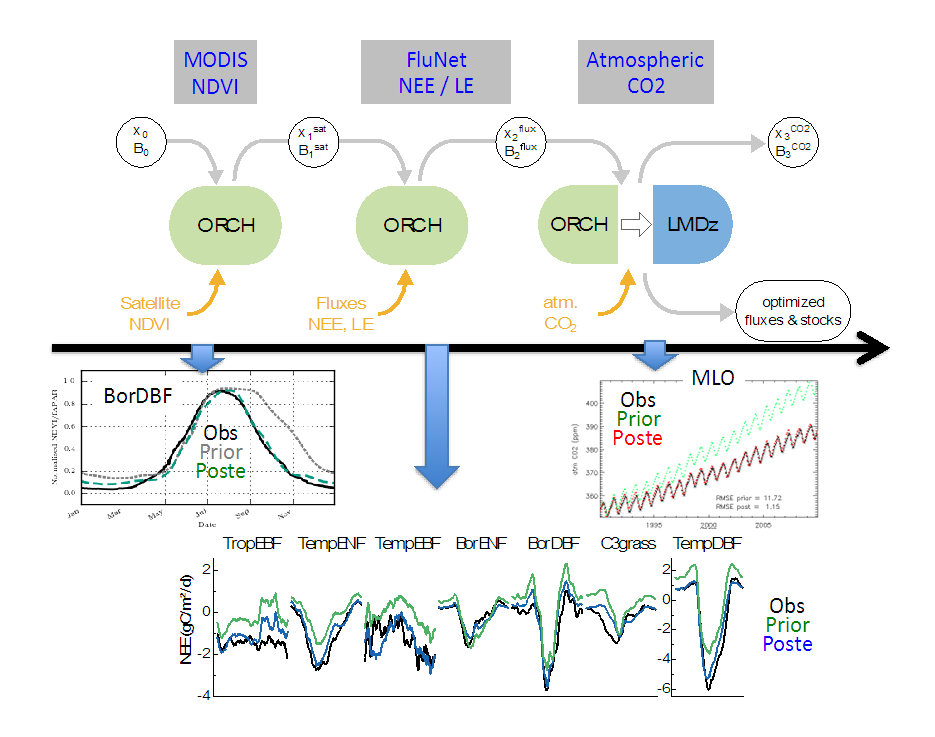
We designed a new step-wise multi-data streams assimilation system where we assimilate sequentially three sets of observations, providing complementary information on the carbon cycle (from local to continental scale), in order to constrain ORCHIDEE’s parameters:
The critical feature of the step-wise system, as described in the figure, consists to propagate the information from one step to the next (i.e., posterior parameter values and error covariance matrix). At each step, the optimization relies on a variational approach that minimizes a cost function describing the model — data mismatch and the prior information on the parameters. Examples of model-data fit are provided in the attached figure for the each data streams. The paper describes i) the benefit of this step-wise approach (i.e. from a practical point of view), compared to a more rigorous simultaneous optimization of all data, streams as well as ii) the potential drawback and the needed consistency checks. Ref.: Peylin et al., Geosci. Model Dev., 9, 3321-3346, doi: 10.5194/gmd-9-3321-2016, 2016 |
|
|
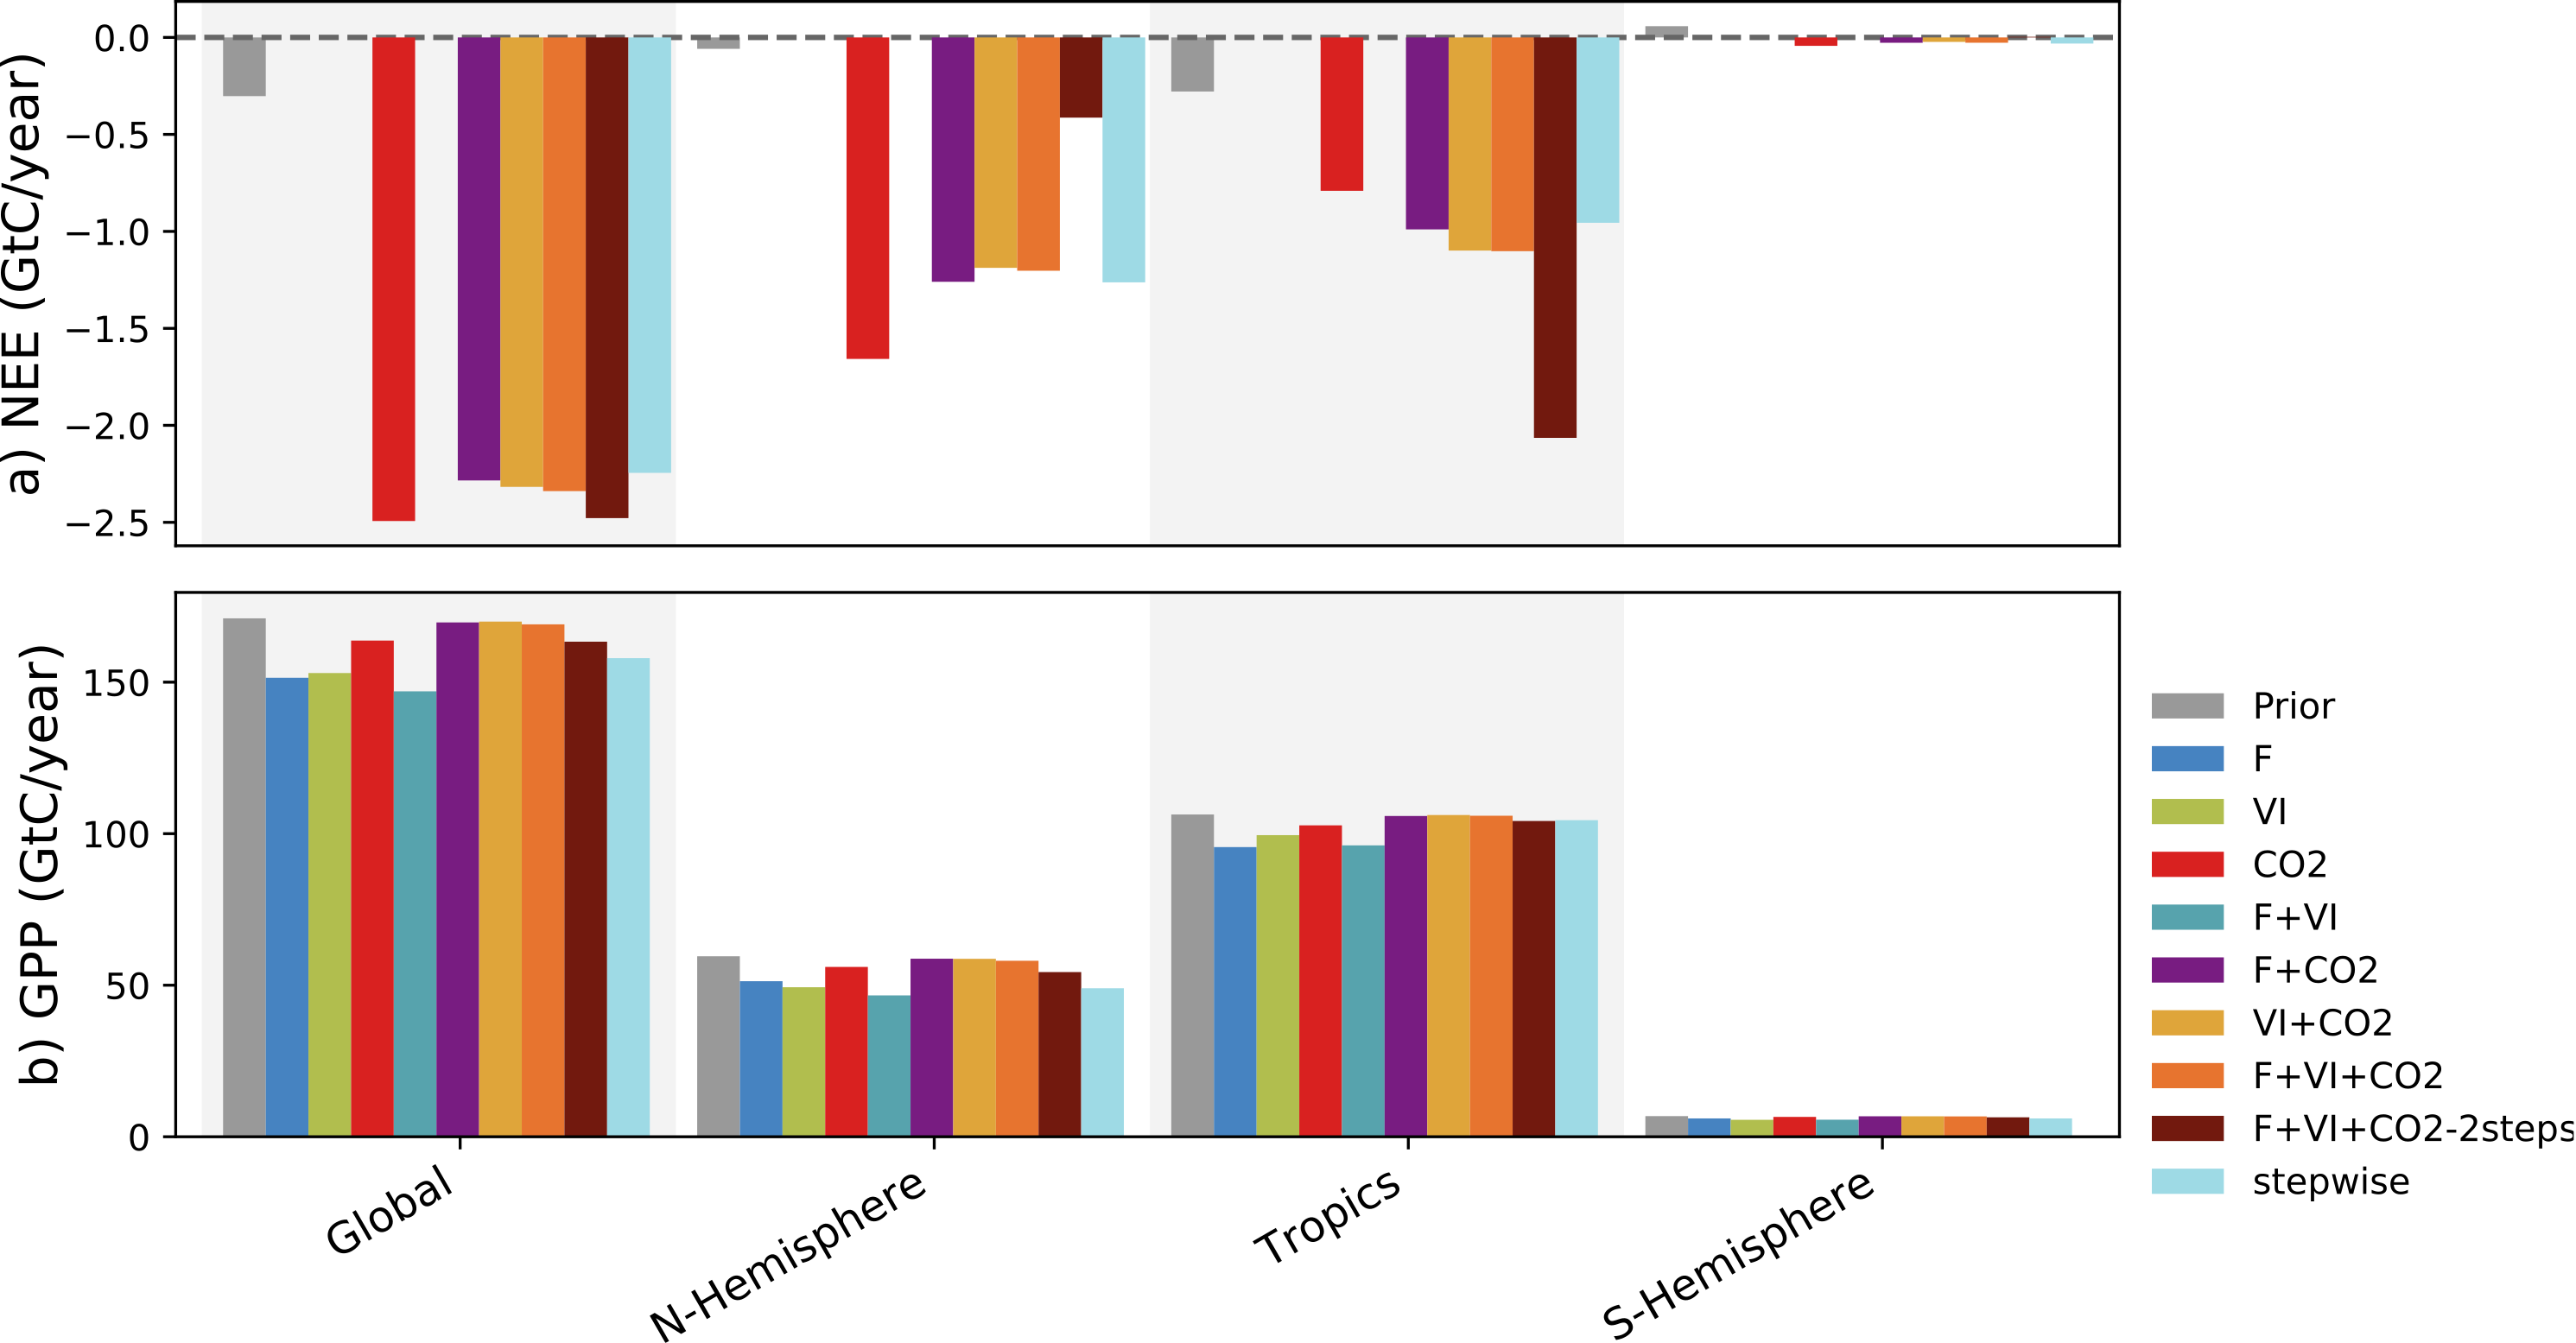
As a follow-up of the above study, we performed comprehensive Data Assimilation (DA) experiments where the same three data-streams (in situ measurements of net carbon exchange and latent heat fluxes, space-borne estimates of the Normalized Difference Vegetation Index, and atmospheric CO2 concentration data measured at stations - but for 10 years of data) were assimilated alone or simultaneously, with the idea of assessing how to make the best of a synergistic exploitation of different data streams within a consistent assimilation framework. We investigated and quantified how the different combinations of data streams constrain the parameters of the ORCHIDEE land surface model, and by consequence the simulated historical spatial and temporal distribution of the net and gross carbon fluxes (NEE and GPP), as well as FAPAR and atmospheric CO2 concentrations. Although it leads to lower fitting performances with respect to the assimilation of any individual dataset the simultaneous assimilation of the three data-streams is found to be the most consistent approach. In particular, it avoids model overfitting which can degrade the model predictions with respect to data-streams not assimilated. The successive model evaluations performed after the assimilations also highlighted challenges in handling model-data bias in Bayesian optimisation frameworks, which were associated to the initialisation of the soil carbon pools in our set-up (the fact that they are out of equilibrium because of all historical land cover change and land mangement impacts). We found that a major challenge in improving the spatial distribution of the land C sinks/sources with atmospheric CO2 data relates to the correction of the soil carbon imbalance. Ref.: Bacour et al., Biogeosciences, 20, 1089–1111, doi: 10.5194/bg-20-1089-2023, 2023 |
|
7. Surface Temperature Data
|
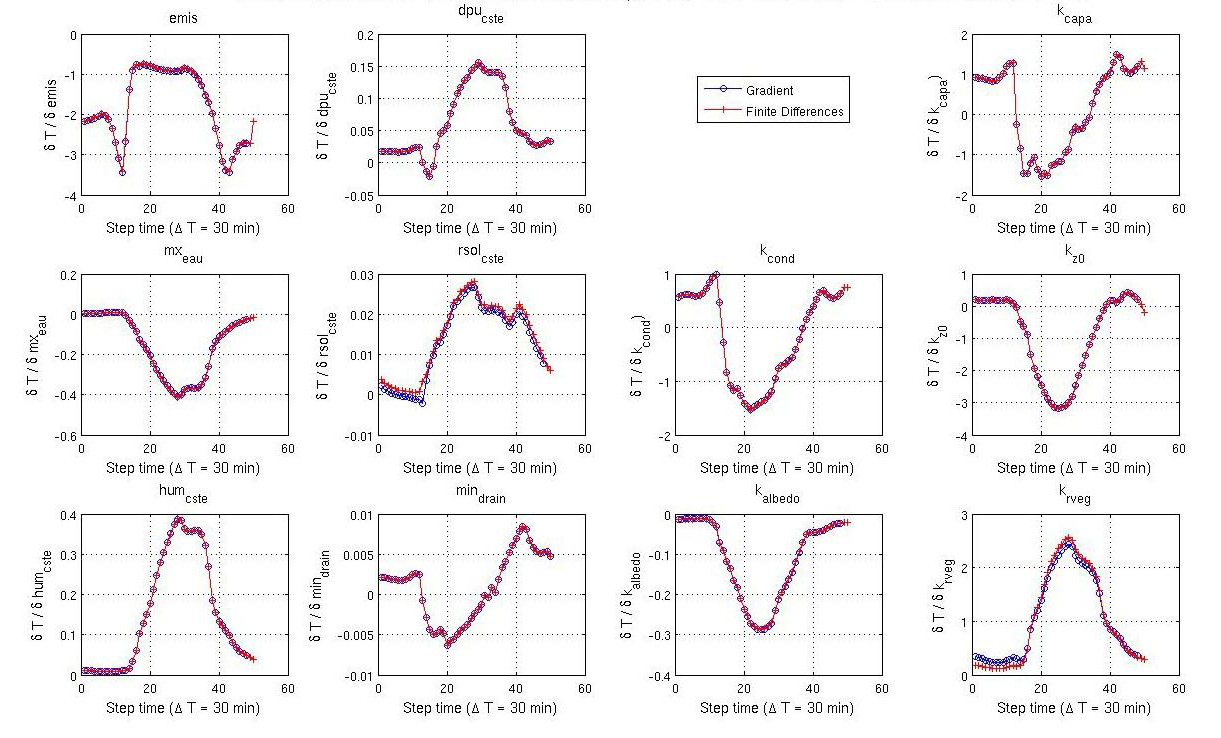
7.1. Variational assimilation of land surface temperature within the ORCHIDEE continental surface model The aim is to test the new tool YAO for automatic adjoint code calculation in assimilation of thermal and hydrological data in ORCHIDEE. The other objective is to estimate how strongly the model parameters are constrained by soil temperature and wetness data (in this case, in situ data at two sites: Harvard Forest and Krüger Park). Ref.: Benavides Pinjosovsky H. S. et al., Geosci. Model Dev., doi: 10.5194/gmd-10-85-2017, 2017 |
|
|
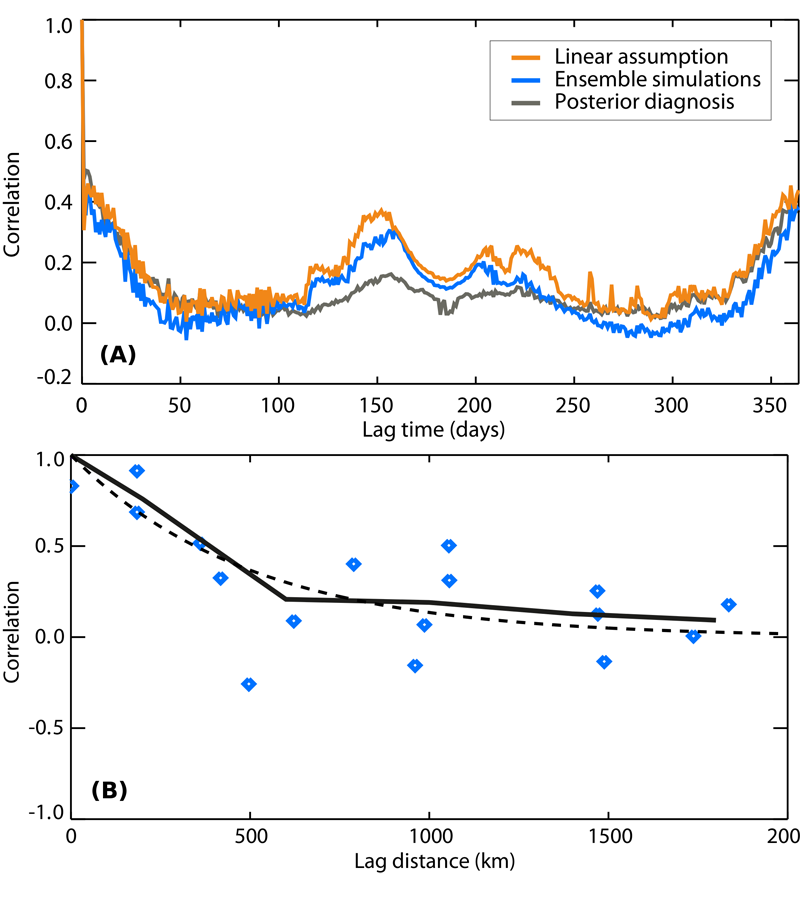
8.1. Quantification of model structural errors using data assimilation This study explores the impact of the structural error of biosphere models when assimilating net ecosystem exchange (NEE) measurements or CO2 concentration measurements to optimize uncertain model parameters within carbon cycle data assimilation systems (CCDAS). We propose a simple method which is derived from the model-minus-observation mismatch statistics, here applied to the ORCHIDEE model using NEE measurements at twelve temperate deciduous broadleaf forest sites. We find that the structural model error significantly dominates the measurement error in the NEE space; it has a standard deviation of 1.5 to 1.7 gC/m2/d, without a significant correlation structure beyond the lag of a few days (Fig. 15A), and possesses a large spatial structure that can be approximated with an exponential decay of e-folding length of 500 km (Fig. 15B). In the space of atmospheric CO2 concentrations, its characteristics are commensurate with the transport errors, both for surface air sample measurements and total column measurements. Ref.: Kuppel S. et al., Geosci. Model Dev., 6, 45-55, doi: 10.5194/gmd-6-45-2013, 2013 |
|
|
8.2. Compared performances of gradient-based vs random search algorithms In this study, we compare two different assimilation approaches — gradient-based (L-BFGS-B algorithm) and random search (Genetic algorithm) — to optimise the ORCHIDEE model with the eddy-covariance observational data (net ecosystem exchange and latent heat fluxes) from 78 sites grouped in seven plant functional types. Assimilation performance is evaluated independently for the single site and multiple site optimisation schemes. We show that the random search approach generally succeeds to provide more appropriate model parameters, however its superiority is significant mostly for the single-site assimilation scheme, while in multi-site approach the gradient-based algorithm tends to reveal a similar performance. Ref.: Bastrikov V. et al., Geosci. Model Dev., 11, 4739-4754, doi: 10.5194/gmd-11-4739-2018, 2018 |
|
|
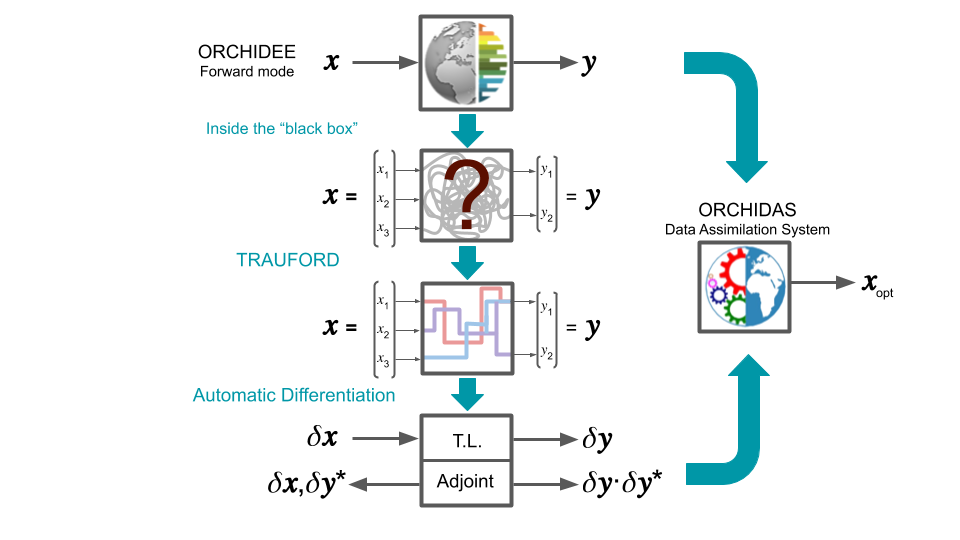
8.3. TRAUFORD tool for preparing Fortran code to automatic differentiation When calibrating a model, different methods can be used to minimise the misfit between observations and the model output. One class of methods is known as deterministic gradient-descent methods. These are highly efficient, often converging with relatively few iterations. To be able to implement these methods, knowledge of the gradient of the cost function with respect to the model parameters is needed. An efficient way to calculate the gradient of the cost function with respect to many parameters is through a tangent linear (TL) model or an adjoint model. However, these can be hard to generate, especially with a complex model like ORCHIDEE. To generate the TL or adjoint model, automatic differentiation (AD) can be used. This is software which can differentiate a computer program. However, a clear mapping between the inputs and outputs of the model is needed before applying this type of software. Furthermore, for an ever-evolving community model like ORCHIDEE, to which new processes can be added approximately every six months, we need to be able to check and translate any given version of model to the right format before using AD software as well as allowing developers to check the sensitivities of their versions. TRAUFORD (TRanslate Automatically and Univocally Fortran cOde for Robust Differentiation) is a tool currently being developed at LSCE to do just that. Once operational, it will be able to preprocess any version of ORCHIDEE, or indeed any Fortran code, ready for automatic differentiation. In addition, since TRAUFORD thoroughly analyses the structure and robustness of the code prior to transformation, work developing this tool has shown how it can further be used to debug models. It has led to the creation of a side-tool, TRACK, which tracks the life (allocation, usage, deallocation) of variables and ensure these variables are well-defined and well treated in the ORCHIDEE model. TRACK will be integrated in the main ORCHIDEE code to help with debugging. |
|
| Last modified: 27/03/2023 11:03:20 |
| Publications → |