Part 1. Choosing data streams
The following is a list of typical data streams that are used in Carbon Cycle Data Assimilation Studies:
Ground-based / site level data:
- Net CO2 (NEE) and latent heat (evapotranspiration) (LE) fluxes (half-hourly timescale; few km2; more than 500 flux towers across the globe: http://fluxnet.ornl.gov). NOTE: the NEE flux can be partitioned into the component gross C fluxes — Gross Primary Production (GPP) and Total Ecosystem Respiration (TER) with the use of a model Reichstein et al. (2005)
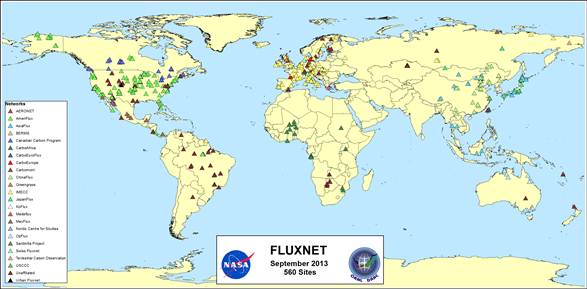
Figure 1. Location of the Flux Tower sites (FLUXNET)
- Aboveground Biomass (annual timescale; average of several trees per plot; no global network — done at a site depending on aims of site PI); measured using height measurement and allometry relationships
- Aboveground biomass increment (annual timescale; average of several trees per plot; no global network — done at a site depending on aims of site PI); measured using various different techniques (diameter increment + allometric relationships)
- Total soil C ("one-off" measurement; usually only an integrated measure for a given soil depth; no global network — done at a site depending on aims of site PI); Global database exists based on individual measurements (HWSD map)
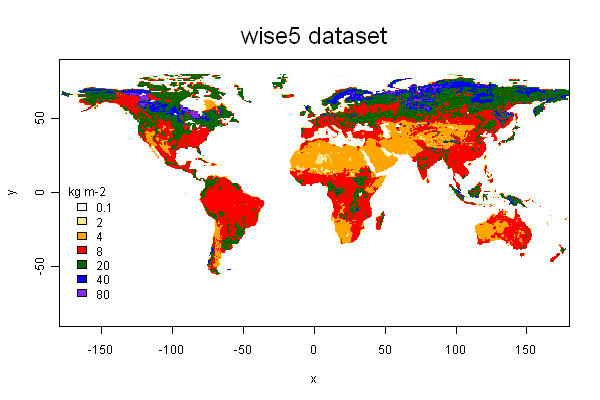
Figure 2. Soil Carbon distribution from the WISE data set
- Soil moisture (~half-hourly; average of several sites; International Soil Moisture Network established)
- Atm CO2 concentration flask data (either flask measurement (usually weekly) or continuous measurements; more than 150 sites globally distributed)
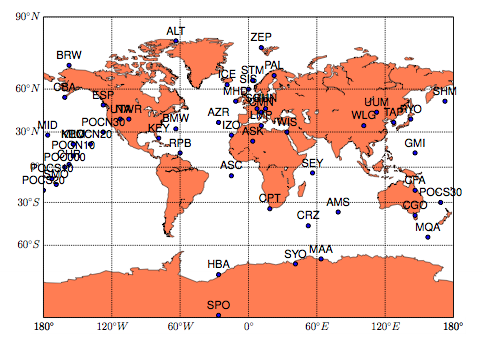
Figure 3. Location of the atmospheric stations
Satellite global dataset:
- NDVI/LAI/fAPAR
- Soil moisture
- Total column CO2
- Aboveground woody biomass in future (e.g. ESA BIOMASS mission)
- Global burned area product
Inventory data
- National forest inventory data (aboveground biomass): National or province level data; derived through an ensemble of plot measurements (using allometric relationships and height measurements); usually repeated every 10 years; mainly for Europe and North America;
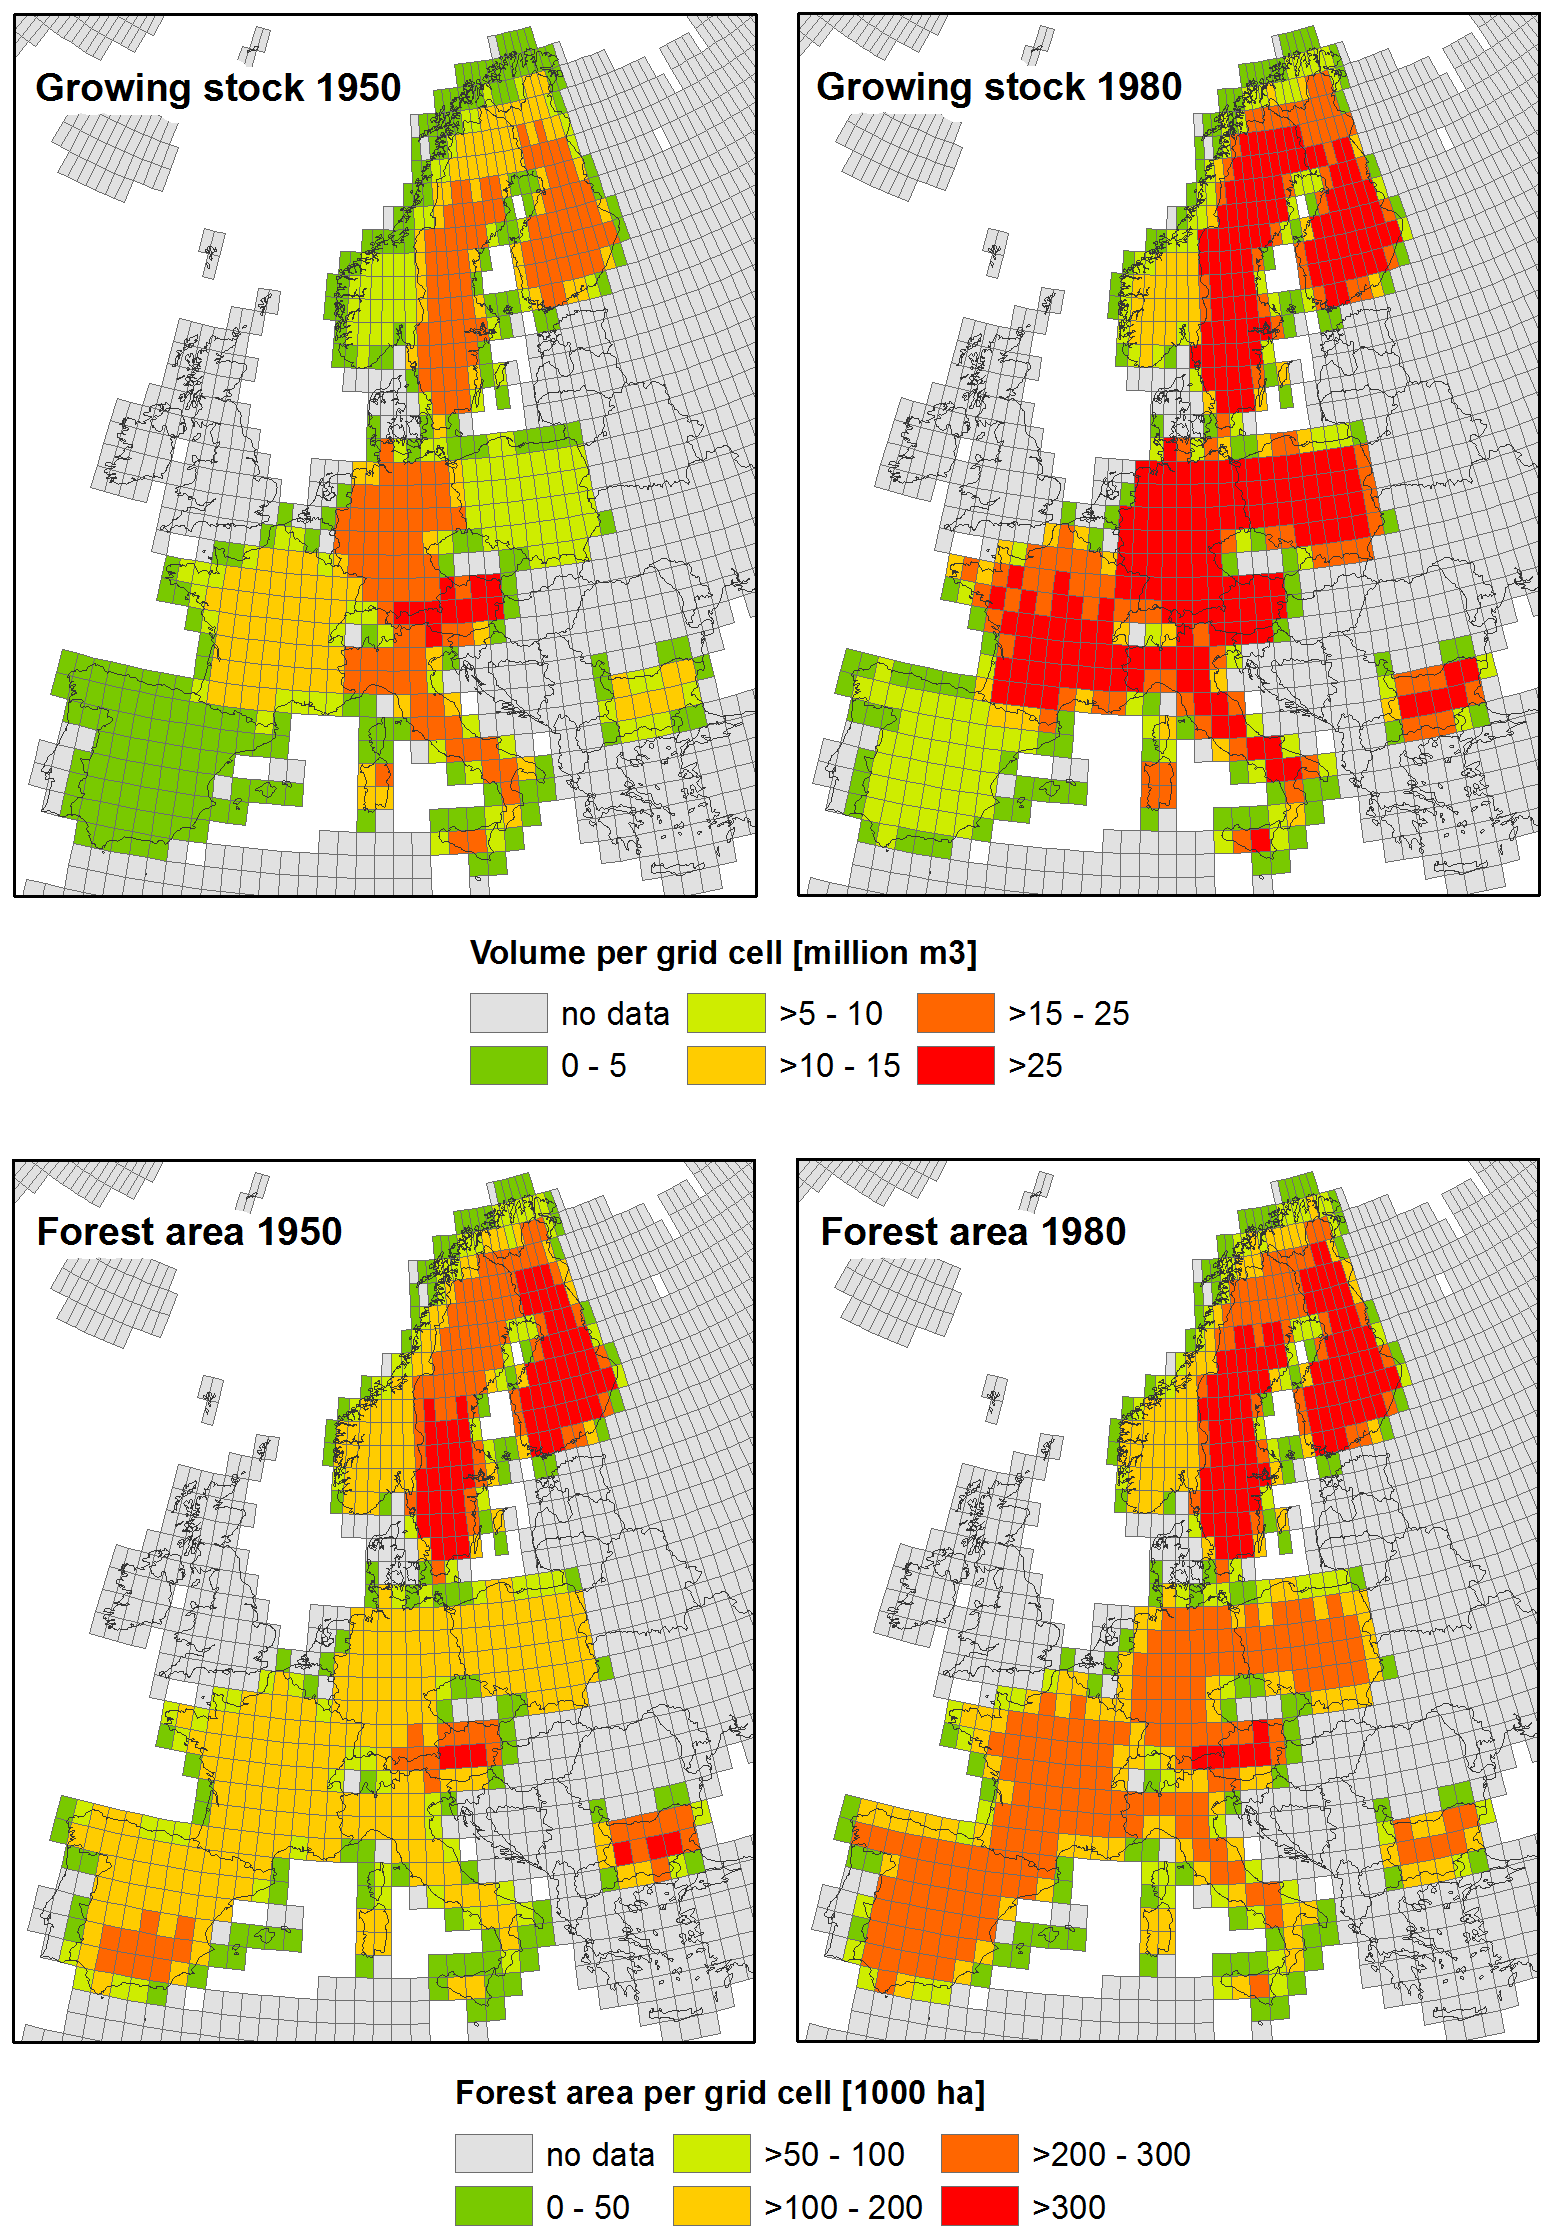
Figure 4. Maps of forest area and growing stock in 1950 and 1980, 1x1 degree resolution for European countries.
Summary of the temporal and spatial associated to the data streams
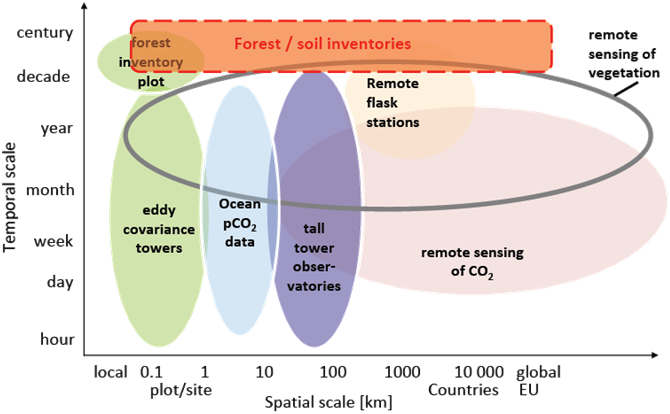
Figure 5. Diagram of the data spatial and temporal constraints of these data streams
Following the presentation on ORCHIDEE, Krinner et al. (2005) paper you have, plus any knowledge you may have on ecosystem models and biogeochemical cycles, try to think about and answer the following questions:
- What are the benefits of each data stream in terms of constraining the model?
- Why might we want to use different data streams?
- What are the potential drawbacks of each data stream? (Think about the timescale and spatial scale of the observations and of the model, as well as the "ease" of getting the observations, and any mismatch between the observation and typical modelled quantities).
- What other data streams do you think may be useful (both existing and from possible future measurement campaigns/satellite missions?