Part 5. Impact of different data streams at site level
In one DA study we have done with ORCHIDEE, we've compared different data streams to optimize the model at both a temperate broadleaved deciduous site (TeBD) and a temperate needleleaved evergreen site (TeNE).
The assimilation was performed with the Genetic Algorithm, and the parameters optimized are given in Table 3.
Table 3. The flux related optimized parameters. The prior value is given first for the TeBD site and then for the TeBE site, if the value is different.
| Parameter |
Description |
Units |
Prior value |
| Photosynthesis |
| Vcmax |
Maximum carboxylation rate |
μmol m–2s–1 |
55.0/35.1 |
| Gs,slope |
Slope in the stomatal conductance equation (Ball-Berry) |
— |
9.0 |
| cT,opt |
Offset for optimal photosynthesis temperature relationship |
°C |
26.0/25.0 |
| cT,min |
Offset for minimal photosynthesis temperature relationship |
°C |
–2/–4 |
| cT,max |
Offset for maximum photosynthesis temperature relationship |
°C |
38.0 |
| SLA |
Specific leaf area (LAI per dry matter content) |
m2g–1 |
0.026/0.00926 |
| LAImax |
Maximum LAI |
m2m–2 |
5.0 |
| Klai,happy |
LAI threshold to stop using carbohydrates |
— |
0.5 |
| Fstress |
Limit to photosynthesis from soil water stress |
— |
6.0 |
| Phenology |
| Kpheno,crit |
Multiplicative factor for growing season start threshold |
— |
1.0 |
| cT,senescence |
Offset for temperature threshold for senescence |
°C |
12.0 |
| Lagecrit |
Average critical age for leaves |
days |
180/910 |
| Tleafinit |
Time to attain the initial foliage using carbohydrate reserve |
days |
10 |
| Soil water availability |
| Humcste |
Root profile |
|
|
| Respiration |
| Q10 |
Temperature dependence of heterotrophic respiration |
— |
1.99 |
| KsoilC |
Multiplicative factor of initial carbon pools |
— |
1.0 |
| HRH,a |
First-degree coefficient of the moisture control of heterotrophic respiration |
— |
–1.1 |
| HRH,b |
First-degree coefficient of the moisture control of heterotrophic respiration |
— |
2.4 |
| HRH,c |
Offset of the function for moisture control factor of heterotrophic respiration |
— |
–0.29 |
| HRH,min |
Minimum value of the function for moisture control factor of heterotrophic respiration |
— |
0.25 |
| MRa |
Slope of the relationship between temperature and autotrophic respiration |
— |
0.16 |
| MRb |
Offset of the relationship between temperature and autotrophic respiration |
— |
1.0 |
| GRfrac |
Fraction of biomass available for growth respiration |
— |
0.28 |
| Zdecomp |
Scaling depth determining effect of soil water on litter decomposition |
— |
0.2 |
| Hcrit_litter |
Scaling depth determining the litter humidity |
— |
0.08 |
| Energy balance |
| Z0overheight |
Roughness length |
m |
0.0625 |
| Kalbedo,veg |
Multiplying factor for surface albedo |
— |
1.0 |
| Allocation |
| r0 |
Controlling allocation to fine roots |
— |
0.3 |
| s0 |
Controlling allocation to sapwood |
— |
0.3 |
| Sinit |
Initial allocation of sapwood aboveground |
— |
0.2 |
| dalloc |
Time constant for aboveground sapwood allocation |
year |
5 |
| Tres |
Residence time / Mortality |
year |
40 |
A spin up of the model was performed and then the forest aboveground biomass was returned to zero in the year 1965, corresponding to real forest cut at that time. The model was then run up to the present day. The aim is to try to simulate the real age of the forest, else the simulated biomass will be too high.
Four different optimization experiments were performed using:
- LE, GPP, TER, Aboveground biomass increment (AboBmInc)
- LE, GPP, TER
- LE, NEE
- AboBmInc
Test 1 can be seen as a reference optimization with all data streams.
The aim of test 2 is to see the impact of only having the fluxes and not the aboveground biomass.
The aim of test 3 is to see the impact of only using the net C flux and not the two gross fluxes.
The aim of test 4 is to see how well we can do with only biomass increment data.
The figures below show the prior and posterior model simulations for the Temperate Broadleaved Deciduous site compared to the observations for each test.

Figure. The micrometeorological fluxes (GPP, TER and LE (Qle)) and annual aboveground biomass increments at the Temperate Broadleaved deciduous site in 2001-2004 when assimilating all of these datastreams (Test 1). The 15-day running averages of the flux daily values are shown.
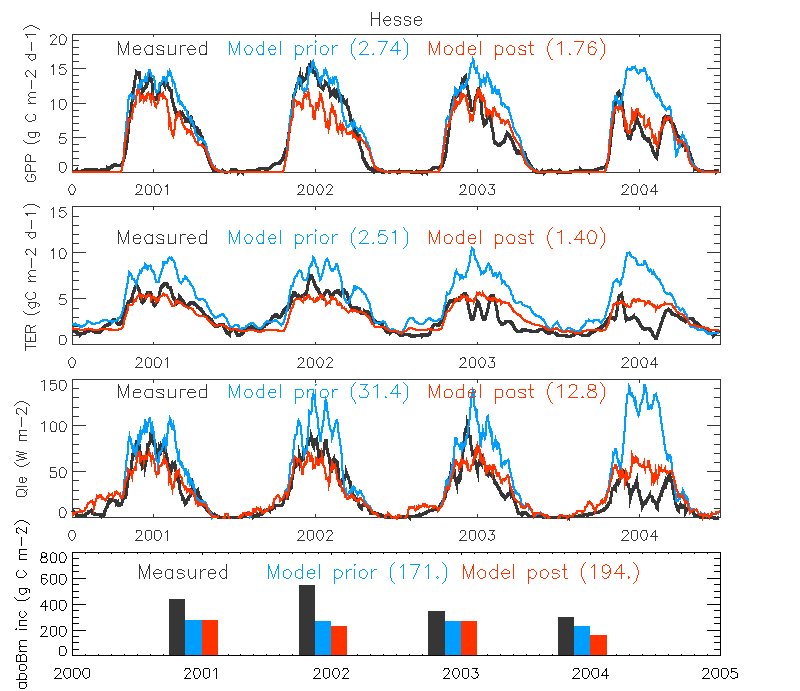
Figure. The micrometeorological fluxes (GPP, TER and LE (Qle)) and annual aboveground biomass increments at the Temperate Broadleaved deciduous site in 2001-2004 when assimilating ONLY GPP, TER and LE (Test 2). The 15-day running averages of the flux daily values are shown. The measurements are shown in black, a priori simulation result as green and a posteriori in red. The RMSE value between simulation and observation is shown in parenthesis.
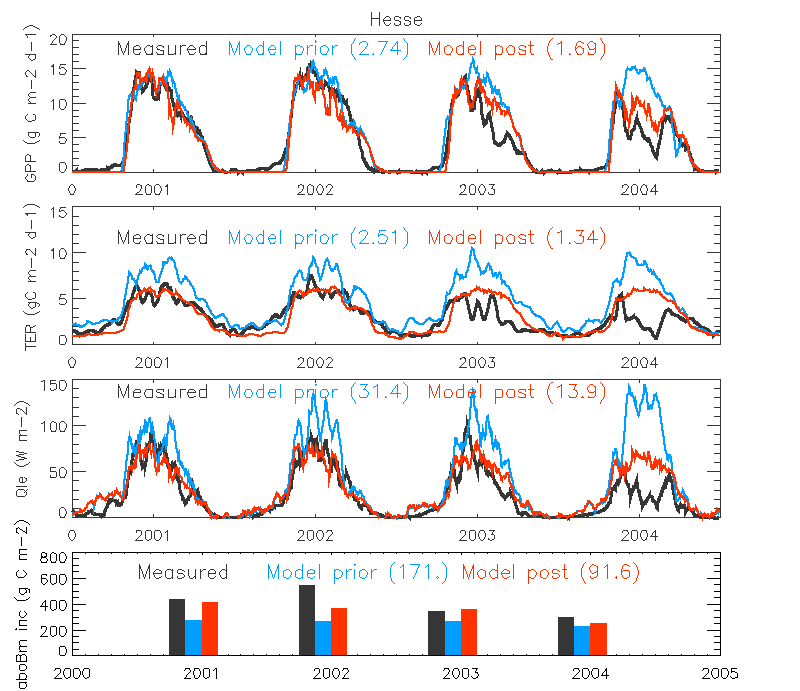
Figure. The micrometeorological fluxes (GPP, TER and LE (Qle)) and annual aboveground biomass increments at the Temperate Broadleaved deciduous site in 2001-2004 when assimilating ONLY NEE and LE (Test 3). The 15-day running averages of the flux daily values are shown. The measurements are shown in black, a priori simulation result as green and a posteriori in red. The RMSE value between simulation and observation is shown in parenthesis.
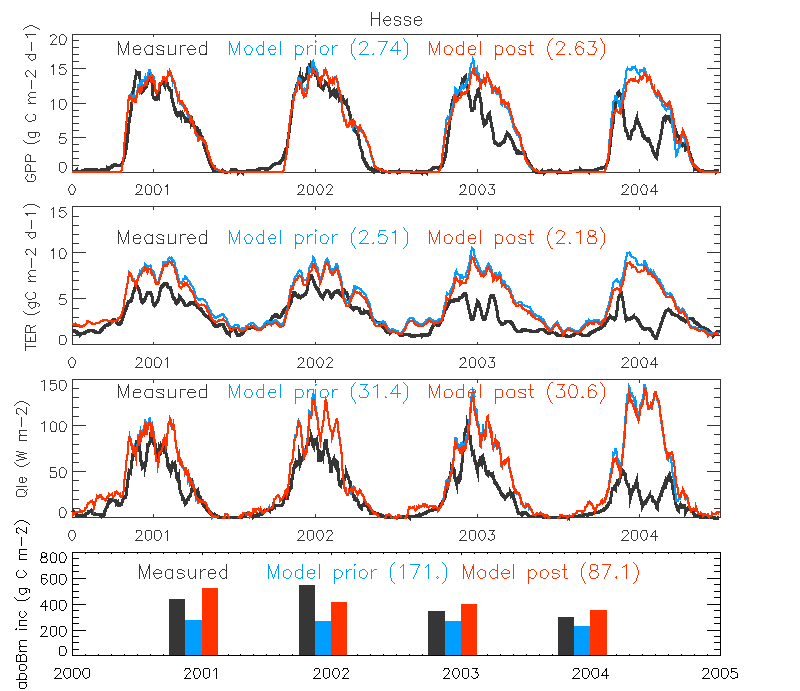
Figure. The micrometeorological fluxes (GPP, TER and LE (Qle)) and annual aboveground biomass increments at the Temperate Broadleaved deciduous site in 2001-2004 when assimilating ONLY the aboveground biomass increments (Test 4). The 15-day running averages of the flux daily values are shown. The measurements are shown in black, a priori simulation result as green and a posteriori in red. The RMSE value between simulation and observation is shown in parenthesis.
Table 4. RMSE values and biases (in parenthesis) for different observations between various optimizations at Hesse and Le Bray.
| |
GPP |
TER |
NEE |
LE |
aboBmInc |
| TeBD |
| Prior |
2.741 (1.0) |
2.507 (1.7) |
1.536 (0.74) |
31.40 (17) |
171.3 (-149) |
GPP, TER, LE
AboBmInc |
1.637 (-0.28) |
1.075 (0.13) |
1.255 (0.41) |
16.53 (7.7) |
108.2 (-44) |
| GPP, TER, LE |
1.760 (-0.49) |
1.025 (0.07) |
1.390 (0.56) |
12.76 (2.8) |
193.7 (-172) |
| NEE, LE |
1.691 (0.22) |
1.336 (0.22) |
1.084 (-0.10) |
13.91 (5.3) |
91.6 (-58) |
| AboBmInc |
2.635 (0.90) |
2.184 (1.40) |
1.515 (0.49) |
30.59 (16.7) |
87.1 (15) |
| TeNE |
| Prior |
1.724 (-0.31) |
1.467 (1.01) |
1.256 (-0.11) |
19.10 (-4.4) |
51.3 (-49) |
GPP, TER, LE
AboBmInc |
1.613 (-0.06) |
1.049 (0.06) |
1.708 (-1.32) |
17.73 (-3.6) |
18.3 (13) |
| GPP, TER, LE |
1.626 (-0.02) |
1.070 (1.33) |
1.626 (-0.07) |
16.94 (-2.8) |
328.6 (49) |
| NEE, LE |
1.701 (-0.11) |
1.695 (0.16) |
1.088 (-1.16) |
17.30 (-1.2) |
52.9 (328) |
| AboBmInc |
1.718 (-0.31) |
1.471 (1.02) |
1.245 (-0.10) |
19.02 (-4.3) |
11.4 (-4) |
From the figures and table above, think about try to answer the questions below (note, also think if you may need more tests to fully answer the question):
SECTION A
1. Benefit of aboveground biomass increment data
- Why do you think the RMSE of aboveground biomass increment is worse than the prior when assimilating GPP, TER and LE data?
- Why is the RMSE of GPP and TER higher when you just assimilate GPP, TER and LE, than when you include AboBmInc for both types of forest?
- The AboBmInc is essentially annually integrated NPP, and therefore a constraint on the fluxes but at a different timescale. How do you think an annual flux will be different from a daily flux in terms of constraining the model?
2. Benefit of splitting net fluxes into gross fluxes
- What is the added benefit of separating the net CO2 fluxes (NEE) into its components (GPP and TER) in theory?
- Why does the optimization with GPP and TER produce a larger RMSE for GPP for the TeBD than the optimization with NEE?
3. Optimisation of LE flux
- Which is the best combination of data streams for estimating LE? Does this make sense, considering the model physics?
- Which test/set of data streams do think is the best and for what reasons? Or do you think other options should be tested before you make that decision, and if so, what are those options?
SECTION B
In a second step the turnover time was optimized using just aboveground biomass data, providing the following results (Figure 2). Consider this graph and answer the questions below:
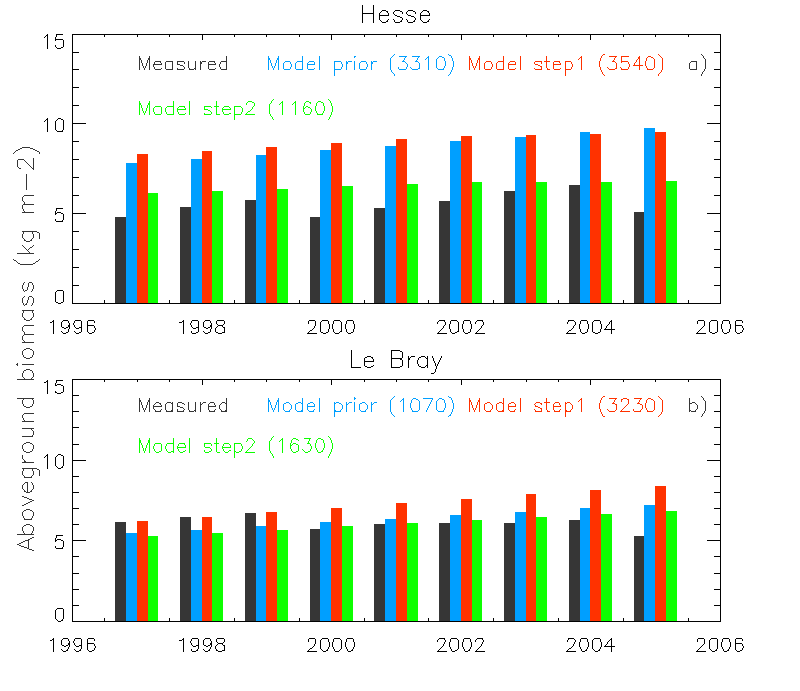
Figure. Caption
- Why does the total aboveground biomass (step 2), and not the biomass increment (step 1), result in an improvement to the total aboveground biomass?
- Is it more important to have biomass increments, or just total biomass?
- Given the background management that has taken place at these sites (thinning nearly every 5 years), and the issues related to forest age in the model as discussed earlier, do you think using total biomass to optimize the model is wise at this stage, and if not, why not?